At heart you divide your sample into 5 pieces of as near to equal size as possible. This involves finding four places to divide them (cutting a sausage in two pieces requires one cut, cutting it in five requires four cuts); these cutting positions are the quintiles.
If your sample size is one more than a multiple of 5, several common formulas for sample quintiles put the respective quintile at the observation which splits the counts of the remaining values in the ratios 1:4,2:3,3:2 and 4:1 (e.g. if you had n=21 those particular formulas will put the quintiles at the 5th, 9th, 13th and 17th sorted values).
If you're not interested in the values taken by the quintiles so much as the values in the 5 bins they create, I'd suggest you try as far as possible to place boundaries in between data values (rather than at data values).
However, there's a variety of other rules which would do slightly different things.
The package R, for example, offers no less than nine rules for quantiles; some will agree with others at particular $n$ and disagree at other values of $n$.
Here's the result of applying the nine rules to quintiles on the values 1,2,...,21:
Method    20%   40%    60%    80%
  1        5     9     13     17
  2        5     9     13     17
  3        4     8     13     17
  4       4.2   8.4   12.6   16.8
  5       4.7   8.9   13.1   17.3
  6       4.4   8.8   13.2   17.6
  7        5     9     13     17
  8      4.600  8.867 13.133 17.400
  9      4.625  8.875 13.125 17.375
Where the number is an integer, that indicates that a particular observation (of the sorted values) is used as the quintile for n=21. When it's not an integer, a weighted average is used (e.g. under method 8, the first quintile is 0.4 x the fourth-largest and 0.6 x the fifth-largest).
The details of the nine* methods are given in Hyndman, R. J. and Fan, Y. (1996) "Sample quantiles in statistical packages," American Statistician 50, 361–365, and also on the R help page on the quantile function (alternative location here).
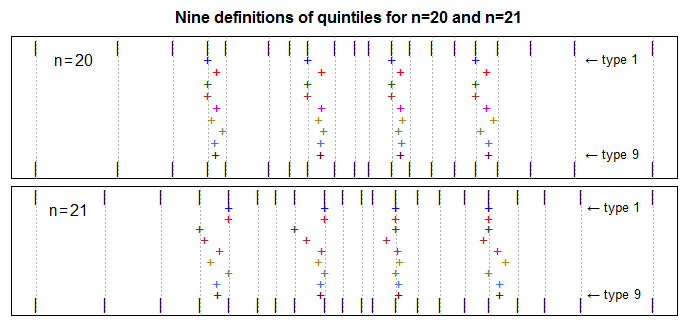
At n=19, n=20 and n=22 the picture is different again. Here's a visual display of the variation in values for the different definitions at n=20 and 21:

As you see, the question is not simple! It really depends on which definition you want. Personally I lean toward types 2 and 7 (I tend to use something close to 2 if working by hand, and just take the default 7 when using R; the two are pretty similar).
is the range from the arithmetic average and the top of the set smaller than the range from the third quintile to the fifth quintile?
There are only four quintiles, the 20th, 40th, 60th and 80th percentiles. You need to clarify your intent there. By "fifth quintile" do you intend the largest value in the sample?
However, I will say that in general there's no set relationship between $\max-\text{mean}$ and some particular inter-quintile range; the relative sizes depend on the shape of the distribution.
It's quite possible for the mean to lie above the fourth quintile or below the first quintile. The maximum must of course lie above (or equal to) the fourth quintile.
An example of a set of numbers where the mean lies above the fourth quintile:
(1, 1.5, 2, 2.5, 3, 3.5, 4, 4.5, 5, 100)
(that works for any of the nine definitions we've looked at examples of).
To get a set of numbers where the mean is below the first quintile, subtract these numbers from 101.
will it always be that the the third, fourth and fifth quintile will have more members than the rightmost-to-average set
This attempt to clarify doesn't seem to make it much clearer; this again suggests the existence of a fifth quintile when there are only four - again, do you perhaps mean the maximum?
Between each pair of adjacent quintiles you should have (almost exactly) 20% of the data. The minimum to mean or mean to maximum could contain more than 80% of the values or less than 20% of the values.
However, it may be possible to derive a bound in the relationship between max-mean and some interquintile range; I don't recall having seen one but it would be interesting to explore.

