In multidimensional scaling, how can one determine dimensionality of a solution given a stress value? From what I understand, stress value is inversely related to the number of dimensions of a MDS solution, and that higher stress value indicates that there is a lot of error (i.e. badness-of-fit) in the current model, indicating a solution with more dimensions. Are the randomly generated coordinates, number of variables, and number of categories in a variable related?
2 Answers
In multidimensional scaling, how can one determine dimensionality of a solution given a stress value?
Having a stress value it is not possible to determine the dimensionality of the dataset. At best, you can evaluate whether the value is low or high (this evaluation is also a bit problematic to me).
From what I understand, stress value is inversely related to the number of dimensions of a MDS solution,
correct
and that higher stress value indicates that there is a lot of error (i.e. badness-of-fit) in the current model,
correct
indicating a solution with more dimensions.
Not very accurate conclusion. consider stress as a function, "number of dimensions" is one of the inputs of this function. The others [significant factors] are the model that you are using as your MDS model, the initial configuration of points in the MDS configuration(map) or even the order of rows/columns in the dissimilarity matrix. Therefore, you will get different stress values in 2-dimension space for instance just by changing the initial configuration of the points! [although this change in the stress value is not considerable comparing to the one resulted by change in the number of dimensions]
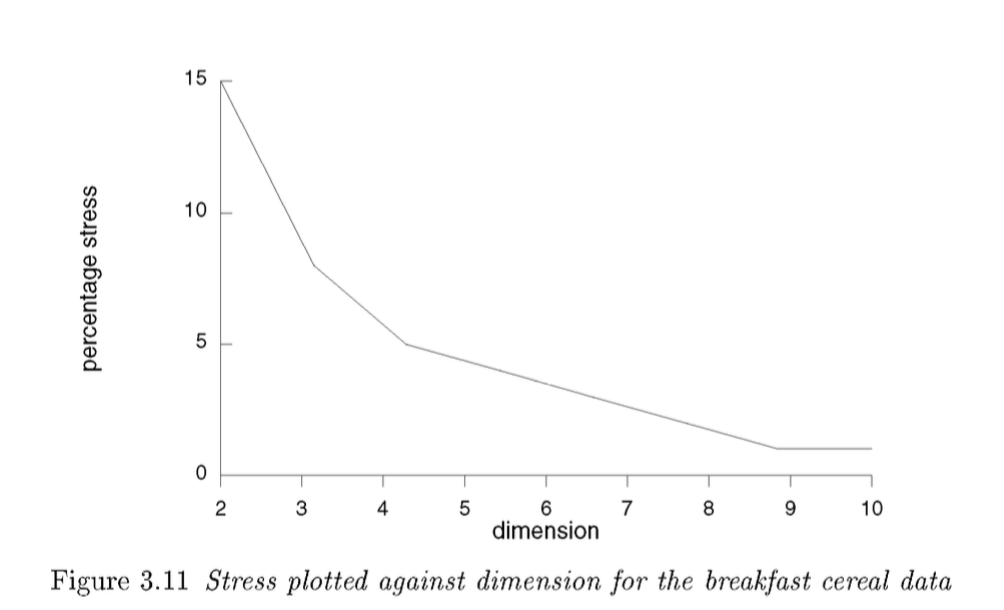
Now if you want to figure out the most proper number of dimensions regarding the stress value, there is a straight-forward solution: In multidimensional scaling, the pragmatic way of depicting the inverse relation of number of dimensions and stress is computing the stress for 2,3,4...,n-1 dimensions. n is the original number of dimension of the data.
The result of above computations becomes more lucid and comprehensible through "Scree plot of number of dimensions ~ amount of stress". The example below is from Cox and Cox(2001): 
Now we can decide about the number of dimensions based on the relation. It is a trade-off: more dimensions-->lower stress (more accurate map) and less dimension reduction(more difficult to visualize and interpret).
Besides, the proper number of dimensions are not decided solely based on stress value. Your goal also matters. If you want to have a 2D map, then you choose 2-dimensions and then try to minimize the stress as much as possible.
Nevertheless, if you are implying "how much stress is too much" then we have another story! one way of evaluation of your magnitude of stress is comparing it to the average stress values of different possible configurations of your dataset. (have look at "Multidimensional Scaling in R: SMACOF" written by Patrick Mair).
Are the randomly generated coordinates, number of variables, and number of categories in a variable related?
Sorry but I don't understand this part of your question.
-
1$\begingroup$ I'm not sure I understand your point "It is possible to perfectly visualize any n-dimensional data in n-1 dimension space". If I have 4 points at the corners of a square in a 2D space, I don't see how I can perfectly represent them in a 1D space w/o losing information. Can you clarify what you mean here? $\endgroup$ Commented Jan 15, 2016 at 19:59
-
1$\begingroup$ Ok, you are right! I put that part in square brackets because it was to somehow off topic and I was not sure about it. Indeed, I have mixed two ideas one from MDS and the other from Correspondence analysis. And my sentence was wrong. sorry for it. But in order to rectify the shaky claim: "in ordinal MDS, any matrix of proximities pij (i < j) can be represented, with zero Stress, in m = n − 2 dimensions" Borg & Groenen (2005) Page47. $\endgroup$– ShahinCommented Jan 15, 2016 at 20:47
-
1$\begingroup$ Also this is from CA literature: "... The dimensionality of this coordinate system is always one less than the number of elements in the profile. For example, we have just seen that three-element profiles are contained exactly in a two-dimensional triangular profile space. For profiles with four elements the dimensionality is three and the profiles lie in a four-pointed tetrahedron in three-dimensional space. " Greenacre(2007) p15 $\endgroup$– ShahinCommented Jan 15, 2016 at 20:54
-
1$\begingroup$ Once again sorry for inaccuracy. I am going to rectify it from the original answer. and thanks for being such an observant! $\endgroup$– ShahinCommented Jan 15, 2016 at 20:55
-
1$\begingroup$ I thought it might have been just a slip of the keyboard. I interpret those quotes to be about the row dimension, & I agree w/ them under that interpretation. A data matrix w/ n rows & p columns (rows are observations & columns are variables) can be perfectly fit in a new variable space w/ min(n-1, p) dimensions. $\endgroup$ Commented Jan 15, 2016 at 21:10
This is old, but one can compute BIC for every dimensionality, and choose the dimensionality with the lowest BIC. BIC is nice in that it accounts for inter-subject variability, model fit (stress), and parametric complexity.
See Lee 2001:
-
$\begingroup$ +1 Fitting answer, this paper addresses the question thoroughly! $\endgroup$ Commented Jul 23, 2021 at 14:43
