1
$\begingroup$

I have a time series data containing roughly 13 000 daily observations, and the initial plan is to fit them to an ARMA model. I have adjusted the data for deterministic trend with a regression model, which basically did nothing to the data. enter image description here One thing the data suffers from is a strong seasonal effect, and I need to adjust for that in order to estimate the ARMA model, and get the white noise from the residuals.
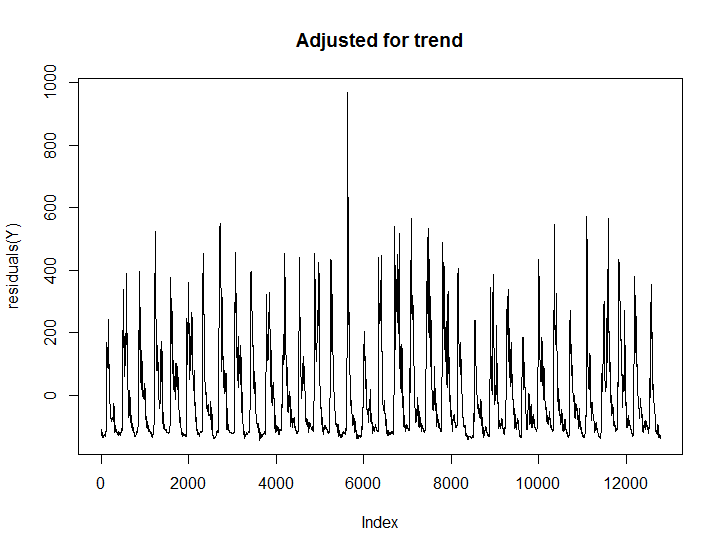
My big problem, and the reason I'm looking for help is because I don't know how to handle the seasonal component. I would like to keep the data in a daily solution since the point with the time series is to be able to model daily changes in weather conditions. But to differentiate the season with a period of 365 is not only impossible in R, but also not theoretical sound, since I would compare the seasonal effect of separate days.

So... does anyone have any idea of what to do when you don't want to do a seasonal adjustment of 12 months or 4 quarters, or should I simply give up the thought of an ARMA model with daily data? It is simple to model the time series with monthly data, but it sort of defeats the purpose of the project.

$\endgroup$
4
  • $\begingroup$ Apart from the R implementation, why would you "compare the seasonal effect of separate days" if you differentiate with a lag of 365 days? $\endgroup$ Commented Dec 4, 2015 at 17:26
  • $\begingroup$ Hi @StephanKolassa My thought is that if you remove the seasonal effect for monthly data over a year, then you'll compare for example January one year with January the next year. So if you differentiate over 365 days it would mean that 1 January one year is compared with the same date another year and that would probably not differ significantly. This is only my interpretation of the problem and could be fundamentally wrong. $\endgroup$
    – Muppetman
    Commented Dec 4, 2015 at 18:46
  • $\begingroup$ Yes, that's exactly what would happen, and that's exactly the way seasonal ARIMA works. So everything is fine! (Except for all the other problems ARIMA has with daily data.) $\endgroup$ Commented Dec 4, 2015 at 19:23
  • $\begingroup$ Thanks for the reassurance @StephanKolassa, it's good to know the logic hasn't left the brain completely. Would you say that another approach than the ARIMA is recommended to model the time series data? I don't have a strict specific way to model the data, I'm just working from the hypothesis that the data can be modeled in some way. I'm currently also fitting the data to a TAR/SETAR model to see if it can be described well in that form. So if I can cross off ARIMA as non effective, that's just a relief. $\endgroup$
    – Muppetman
    Commented Dec 6, 2015 at 11:56

1 Answer 1

5
$\begingroup$

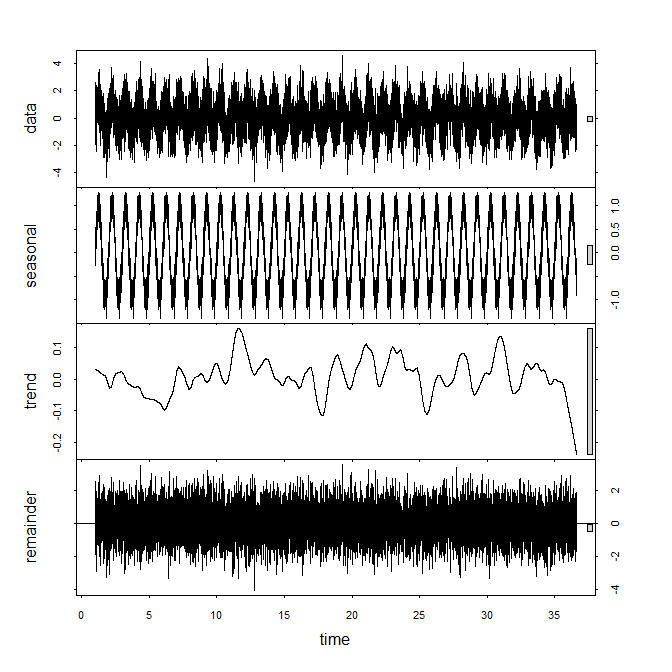
It's probably best to do a standard STL (Season, Trend, Level) decomposition. Here is what you'd do with dummy data:

set.seed(1)
series <- ts(sin((1:13000)*2*pi/365)+rnorm(13000),frequency=365)
foo <- stl(series,s.window="periodic")
plot(foo)

STL

Note that "Time" here is in years, and that this algorithm already accounts for the trend, so you don't need to extract that beforehand.

Afterwards, you can extract the components from foo$time.series, for example foo$time.series[,"remainder"] for the residuals.

An alternative would be exponential smoothing or an equivalent state space model, but forecast::ets also doesn't work with frequencies greater than 24.

You may want to look through some of our earlier questions on daily time series.

$\endgroup$

Your Answer

By clicking “Post Your Answer”, you agree to our terms of service and acknowledge you have read our privacy policy.

Not the answer you're looking for? Browse other questions tagged or ask your own question.