1
$\begingroup$

Edit: I think the data was poorly given, varables coke, pepsi, and sprite were just given in 2 columns when I got it, but it has nothing to do with before and after treatment?

here's the original questions since someone asked For the study, 2 males and 2 females are picked randomly from NYC, and a random sample of 2 males and 2 females are picked from LA. Each person is given 6 drinks (2 from each brand), where the order of the drinks for each person is randomized. Each person rates the drink’s taste, Y, on a scale of 60 to 100, where 100 is the best tasted.

Please let me know if I can provide any other info. Pretty much I am asked to fit ANOVA. End of Edit#

I would like to understand ANOVA in R, I am working in this data set.

dat <- structure(list(city = structure(c(2L, 2L, 2L, 2L, 1L, 1L, 1L, 
1L), .Label = c("LA", "NY"), class = "factor"), sex = structure(c(2L, 
2L, 1L, 1L, 2L, 2L, 1L, 1L), .Label = c("F", "M"), class = "factor"), 
    rater = 1:8, frit0 = c(77L, 72L, 78L, 84L, 77L, 78L, 83L, 
    81L), frit1 = c(76L, 71L, 78L, 84L, 76L, 77L, 86L, 84L), 
    utz0 = c(78L, 73L, 78L, 84L, 74L, 81L, 85L, 83L), utz1 = c(80L, 
    75L, 80L, 86L, 72L, 73L, 81L, 79L), weiss0 = c(78L, 76L, 
    84L, 90L, 78L, 79L, 88L, 86L), weiss1 = c(81L, 73L, 81L, 
    87L, 81L, 82L, 92L, 90L)), .Names = c("city", "sex", "rater", 
"coke0", "coke1", "pepsi0", "pepsi1", "sprite0", "sprite1"), 
 class = "data.frame", row.names = c(NA, -8L))

I want to do an analysis of variance, check assumptions, and interpret results. I am sure this is done many times by the experts, so, what is the correct step to do it?

I have tried

am1 <- aov(coke1 ~ coke0 + sex, data=dat2)
summary(am1)

Is this correct? Or even relevant? thanks in advance!

$\endgroup$
5
  • $\begingroup$ anyways, I just want to add what I have been reading about assumptions for AVNOA, in case other wanted to know! experiment-resources.com/anova-test.html $\endgroup$
    – mike
    Commented Dec 18, 2011 at 4:54
  • $\begingroup$ Some more links. personality-project.org/r/r.anova.html gardenersown.co.uk/Education/Lectures/R/anova.htm. Have you tried searching for "analysis of variance r" in your fav search engine? $\endgroup$ Commented Dec 18, 2011 at 11:10
  • $\begingroup$ @RomanLuštrik: thanks so much for your link, they are good. One thing that frustrates about these ANOVA stuff is that, there is just that one set of numbers(namely, what I have above), and you have to come up with all kinds of effect. I think ANOVA model itself is over-complicating the problem. $\endgroup$
    – mike
    Commented Dec 18, 2011 at 16:31
  • 1
    $\begingroup$ Do you have a question that you are trying to answer ? If so, could you explain the context of your data (ie what are coke1 and coke0 ?) $\endgroup$ Commented Dec 19, 2011 at 9:06
  • $\begingroup$ @PaulHurleyuk: Hi, Paul, I think the problem was poorly given, which lead to my misinterpretation, I edited the question. Basically, I am asked to do ANOVA on a set of data with response on 3 different drinks. $\endgroup$
    – mike
    Commented Dec 20, 2011 at 13:29

2 Answers 2

4
$\begingroup$

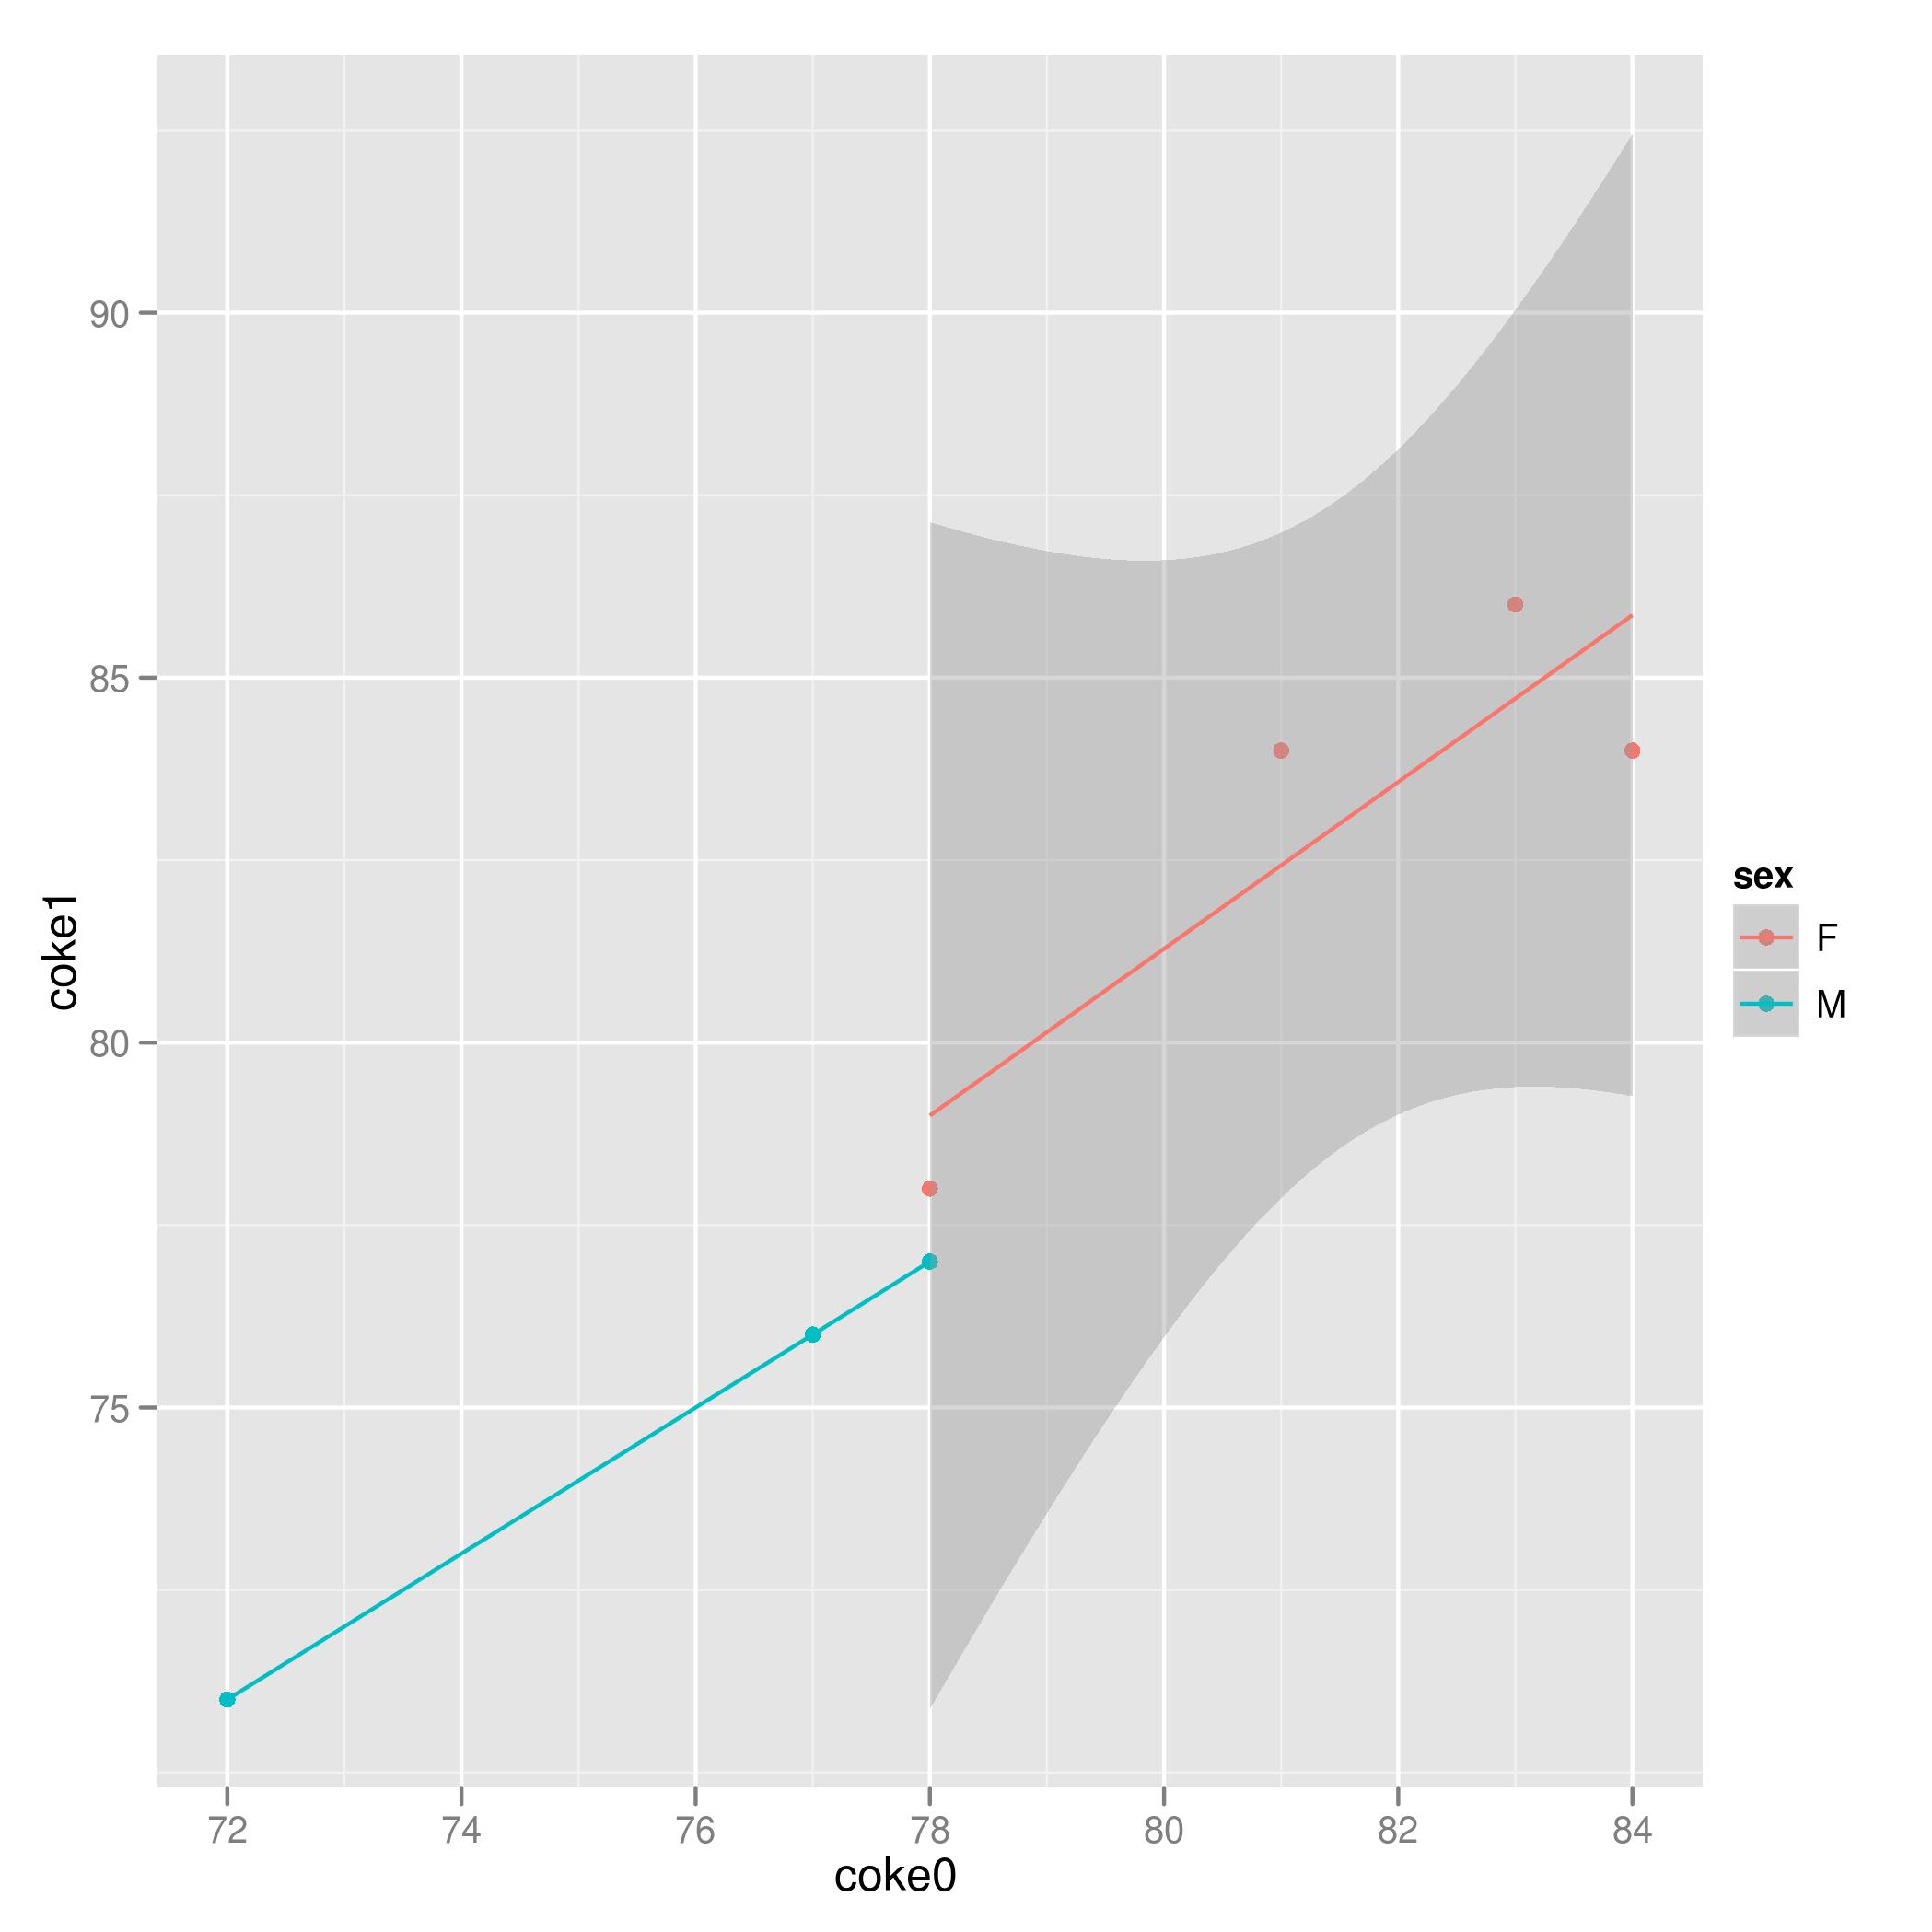
If you think in terms of linear models instead of going directly to ANOVA you may see something very important in the data. Consider the following plot of the data for looking at the response coke1 as a function of coke0 and sex. You'll notice that the responses for Males are perfectly linear making the use of a linear model moot as we already know the 'line of best fit' since the data is a line.

library(ggplot2)
ggplot(dat) +
  aes(x = coke0, y = coke1, color = sex) + 
  geom_point() + 
  stat_smooth(method = 'lm')

You may continue with an ANOVA, I would do so as:

g <- lm(coke1 ~ sex + coke0, data = dat)
plot(g) # graphics to check some model assumptions
anova(g)

The ANOVA results should look like:

Analysis of Variance Table

Response: coke1
          Df  Sum Sq Mean Sq F value    Pr(>F)     
sex        1 128.000 128.000  72.804 0.0003639 ***
coke0      1  49.209  49.209  27.989 0.0032170 ** 
Residuals  5   8.791   1.758                      
---
Signif. codes:  0 ‘***’ 0.001 ‘**’ 0.01 ‘*’ 0.05 ‘.’ 0.1 ‘ ’ 1 
$\endgroup$
3
  • $\begingroup$ thanks, 'ggplot2' is awesome! So, I guess there are 3 analysis of variance? Since I can do a before and after on pepsi, coke, and sprite, am I correct? I am just very confused about the concept of anova, why am I using linear regression? $\endgroup$
    – mike
    Commented Dec 19, 2011 at 0:53
  • $\begingroup$ @mike You will get the same results from using a linear model approach as you will for just using summary(aov()) The advantage with using lm() is you can visualize the results. ANOVA is good for testing the hypothesis that two or more means are equal to each other versus the alternative hypothesis that at least one of the means is different from the others. In this case you appear to be looking to test the null hypothesis the score for coke1 is the same between the two sexes. ANOVA, also called ANCOVA, also allows for such tests after accounting for a covariate, such as coke0. $\endgroup$
    – Peter
    Commented Dec 19, 2011 at 17:27
  • $\begingroup$ I am just confused why I need regression model when I do ANOVA. It seems to me that AVONA and linear regression belongs to 2 different courses. $\endgroup$
    – mike
    Commented Dec 20, 2011 at 13:31
2
$\begingroup$

so, from describing your data, it seems your dataset is in the wrong format. Generaly I would recomend having one set of data per row, so each rating of a drink is one row, with an indication of their sex, city, the drink type (and if you knew it the order of the tasting). Luckily Hadley Wickham and the amazing reshape2 package comes quickly to your aid

library(reshape2)
library(ggplot2)

melteddata<-melt(data=dat, id.vars=c("city", "sex", "rater"))

Now, you can examine your data to see what you can see

qplot(data=melteddata, y=value, x=variable, colour=sex, shape=city)

Generaly, Males score lower than Women, and maybe LA scores higher than NY. Finaly, you can do your anova, investigating the variability when trying to predict response based on all the other variables.

aovobj<-aov(value~city*sex*rater*variable, data=melteddata)

summary(aovobj)
$\endgroup$

Your Answer

By clicking “Post Your Answer”, you agree to our terms of service and acknowledge you have read our privacy policy.

Not the answer you're looking for? Browse other questions tagged or ask your own question.