I have daily counts of observed disease cases for a single location. I am interested in the peak timing of the outbreak of the disease and want to assess the uncertainty in the peak estimate. In other words, if there is a maximum of 20 cases on day 100, and there were 19 cases for days 98, 99 and 101 and 102, I cannot be sure that the true number of cases in the population peaked on day 100. I want to create a 95% CI around the peak timing, e.g., peak day = [99,101].
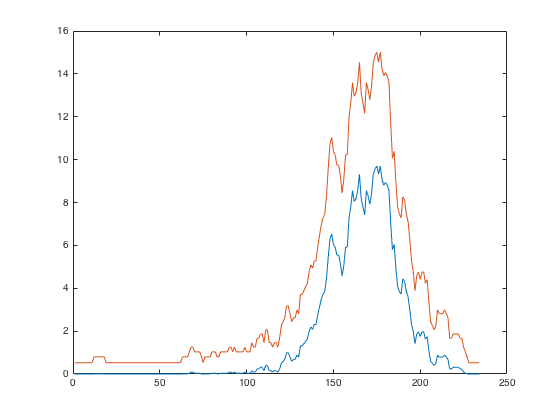
I have begun this process by estimating the intensity parameter for a poisson process using poissfit in Matlab using and sliding window of 7 days (sum counts across window). This provides the MLE and the 95% CI (see figure below):
A simple way to infer the 95% CI would be to use the maximum lower 95% CI as a threshold and only include days with upper 95% CI bounds greater than this threshold. For example, in the image above you could take the lower bound of ~10 at the peak ~180 days and eliminate days where the upper bound of the CI did not exceed this threshold. Doing this would suggest the peak occurred between day ~150-200. However, this seems like an extremely conservative estimate and would lead to large CIs. Anybody have a better approach, perhaps using some sort of time-series or joint probability method?

