I would like to know how to find out the analytical solution of a simple linear regression with fixed intercept = 0:
$$ s = e^{-ht}$$ $$ y = -ln(s) = h\cdot t$$
Here ist the background: I have three survival probabilities $s$ at 30, 90 and 180 days. Obviously, I have at day = 0 100% survival, so I include this observation. I know that this is contested (here) but I think in this special case it makes sense. The data I use for fitting the linear regression:
>     obs
    t    s          y
1   0 1.00 0.00000000
2  30 0.98 0.02020271
3  90 0.90 0.10536052
4 180 0.80 0.22314355
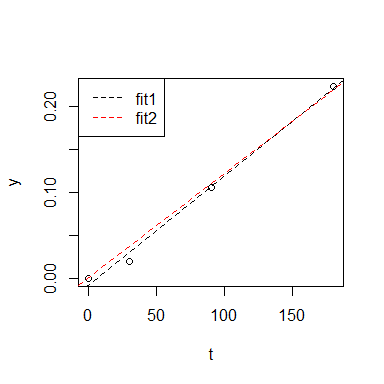
If I fit with simple regression I get this:
>     (fit1 <- lm(y~t, data=obs))

Call:
lm(formula = y ~ t, data = obs)

Coefficients:
(Intercept)            t
  -0.008464     0.001275
This can be obtained analytically if the following function is derived:
$$f(h) = \sum (y_i - ht_i)^2$$
which gives:
$$ \frac{\sum (y_i-\bar{y})\cdot (t_i-\bar{t})}{\sum (t_i-\bar{t})^2}$$
UPDATE 1: This is the result of the minimization of $$f(h) = \sum (y_i - c - ht_i)^2$$. The correct result (see answers): $$ \frac{\sum (y_i\cdot t_i)}{\sum t_i^2}$$
The analytical results is:
yc <- with(obs,y-mean(y))
tc <- with(obs, t -  mean(t))
sum(yc*tc)/sum(tc^2)
[1] 0.001275204
The same as coefficient in the fit1. Now, if I fix intercept to intercept=0 I get this:
>     (fit2 <- lm(y~0+t, data=obs))

Call:
lm(formula = y ~ 0 + t, data = obs)

Coefficients:
   t
0.001214
I'm wondering how I can get an analytical solution for this. How I have to consider the fix intercept in the function $f(h)$ above?
Any idea is appreciated.
Here is the way I constructed the data:
set.seed(123)
# Hazard ratio
h <- 0.7
# Number of observation
n <- 50
# Model: exponential
t <- rexp(n,h)
# scale to days
t <- t*365.25
hist(t)
t <- sort(t)
# Put data into a dataframe
df0 <- data.frame(t=t)
head(df0)
# Compute probablities
df0$s <- 1 - c(1:n)/n
head(df0)
# Extract survival probabilities at 30,90 and 180 days
df0$t2 <- ceiling(df0$t/30)*30
# Select survival probablity 30, 90, 180 days
library(sqldf)
obs <- sqldf("SELECT t2 t, MAX(s) s FROM df0 WHERE t2 IN (30,90,180) GROUP BY t2")
# Add survival probability=1 at day 0
obs <- rbind(data.frame(t = 0, s = 1), obs)
# s = e^(-ht)  => y = -ln(s) = h*t
obs$y <- -log(obs$s)
plot(y~t, data=obs)
fit1 <- lm(y~t, data=obs)
abline(fit1,lty=2)
fit2 <- lm(y~0+t, data=obs)
abline(fit2,lty=2, col="red")
legend("topleft", legend=c("fit1","fit2"), col=c(1,2), lty=c(2,2))

