14
$\begingroup$

Given random variables $X_1,X_2, \cdots, X_n$ sampled iid from $\sim \mathcal{N}(0, \sigma^2)$, define $$Z = \max_{i \in \{1,2,\cdots, n \}} X_i$$

We have that $\mathbb{E}[Z] \le \sigma \sqrt{2 \log n}$. I was wondering if there are any upper/lower bounds on $\text{Var}(Z)$?

$\endgroup$
4
  • 1
    $\begingroup$ Just to get you started, i think you will find that $Var(Z) \le \sigma^2$ (equality is achieved at n = 1), and Var(Z) decreases as n increases. I leave it to you to provide that tighter bound as a function of n. $\endgroup$ Commented Aug 9, 2016 at 21:50
  • 1
    $\begingroup$ The sample max minus the sample min is known as the studentized range and follows the studentized range distribution if the underlying random variables are IID normal. That's at least vaguely related to what you're asking... (could give a starting point for reading). Back on your specific question, I'm sure you could write a Monte-Carlo simulation rather easily to find a practical answer. $\endgroup$ Commented Aug 9, 2016 at 22:10
  • 2
    $\begingroup$ Both answers to stats.stackexchange.com/questions/105745 provide approximations to the standard deviation (and therefore to the variance), using analyses that might produce upper or lower bounds. $\endgroup$
    – whuber
    Commented Aug 10, 2016 at 15:09
  • $\begingroup$ Related: stats.stackexchange.com/questions/77110/… $\endgroup$ Commented Jan 2, 2017 at 18:38

2 Answers 2

10
$\begingroup$

You can obtain upper bound by applying Talagrand inequality : look at Chatterjee's book (Superconcentration phenomenon for instance) .

It tells you that ${\rm Var}(f)\leq C\sum_{i=1}^n\frac{\|\partial_if\|_2^2}{1+\log( \|\partial_i f||_2/\|\partial_i f\|_1)}$.

For the maximum, you get $\partial_if=1_{X_i=max}$, then by integrating with respect to the Gaussian measure on $\mathbb{R}^n$ you get $\|\partial_if\|_2^2=\|\partial_if\|_1=\frac{1}{n}$ by symmetry. (Here I choose all my rv iid with variance one).

This the true order of the variance : since you have some upper bound on the expectation of the maximum, this article of Eldan-Ding Zhai (On Multiple peaks and moderate deviation of Gaussian supremum) tells you that
${\rm Var}(\max X_i)\geq C/(1+\mathbb{E}[\max X_i])^2$

It is also possible to obtain sharp concentration inequality reflecting these bound on the variance : you can look at http://www.wisdom.weizmann.ac.il/mathusers/gideon/papers/ranDv.pdf or, for more general gaussian process, at my paper https://perso.math.univ-toulouse.fr/ktanguy/files/2012/04/Article-3-brouillon.pdf

In full generality it is rather hard to find the right order of magnitude of the variance of a Gaussien supremum since the tools from concentration theory are always suboptimal for the maximum function.

Why do you need these kinds of estimates if I may ask ?

$\endgroup$
3
  • 1
    $\begingroup$ Note that the Talagrand inequality, is an improvement of the Poincaré inequality satisfied by the standard Gaussian measure. There is more about this in Cordero-Ledoux's article "Hypercontractive measures, Talagrand's inequality and influences". $\endgroup$ Commented Jan 2, 2017 at 11:23
  • 2
    $\begingroup$ Thanks a lot. This helps a lot. I was dealing with the problem where I was trying to bound probability of errors in estimating the length of runs of 0 in a bit stream from observations through a deletion channel. After a Gaussian approximation, the max seemed to be a natural estimator, and I found bounding its performance quite non-trivial. In my particular problem, I could find a way round it by reducing it to a Gaussian MMSE estimation problem. $\endgroup$
    – Devil
    Commented Jan 5, 2017 at 6:12
  • $\begingroup$ @TanguyKevin what's C in the lower bound? $\endgroup$
    – xsari3x
    Commented May 22, 2020 at 6:03
1
$\begingroup$

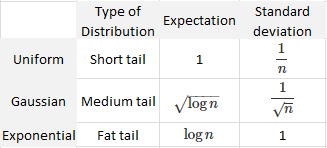
More generally, the expectation and variance of the range depends on how fat the tail of your distribution is. For the variance, it is $O(n^{-B})$ where $B$ depends on your distribution ($B = 2$ for uniform, $B = 1$ for Gaussian, and $B = 0$ for exponential.) See here. The table below shows the order of magnitude for the range.

enter image description here

$\endgroup$

Your Answer

By clicking “Post Your Answer”, you agree to our terms of service and acknowledge you have read our privacy policy.

Not the answer you're looking for? Browse other questions tagged or ask your own question.