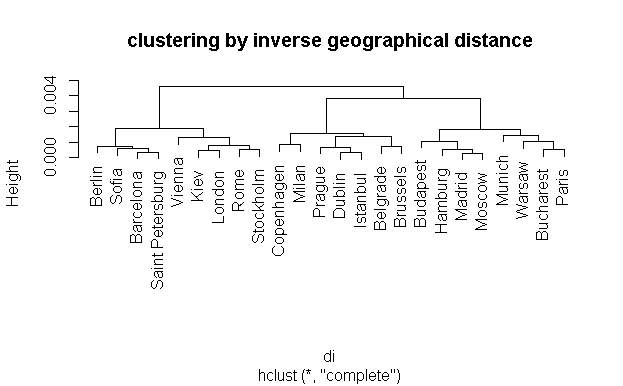
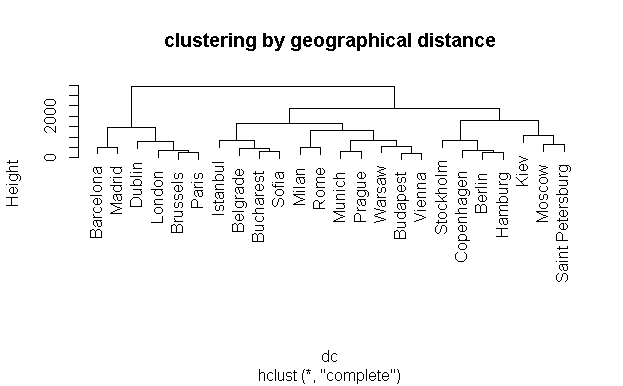
The objective of clustering analysis is to group data with similar characteristics in clusters, but in this case, I want to find the most unrelated data to group into clusters. In my particular case, I have 100 weather stations during one year with a 1hr interval, and I want to group the most similar weather stations(I performed this step with K-means using the correlation distance via MATLAB, but I can use R or Python). But now, I want to perform the inverse, i.e., group in the same cluster unrelated (with no correlation) weather stations .
Is this possible? If yes, how? Or, should I use others techniques to execute my idea?
The main idea is to use the groups to prove a concept often used in wind power designated as statistical power smoothing effect (pdf). Basically, there is a statistical power smoothing effect in the wind power data, if you considered data with different features (e.g., different weather conditions). I want to use this grouping to show if I carefully grouping my weather stations (that will be transformed in wind power), then I can minimize the fluctuations. So far I applied k-means algorithm to select the weather stations with the same behavior, and now I want to explore the opposite. Probably, the technique that I need is not clustering, but so far I search and nothing came up.
@Pere: Yes, I also expected what you mentioned. Can you provide some reference to understand how I can compute the correlation inverse distance?
@Dougal: I want diverse groups, as in the normal cluster. To be honest the goal was to split the data in the same number of the "normal" clustering, in my case 9.
@ Pere: Thank you for the example. But I didn't achieve the expected results since, in my case, some clusters are very close to the ones obtained with the "normal" cluster. Probably it is better to try a trial and error test (adding/removing weather stations) to understand the weather stations that I should combine to smooth my signal.


