11
$\begingroup$

This is a cross post from Math SE.

I have some data (running time of an algorithm) and I think it follows a power law

$$y_\mathrm{reg} = k x^a$$

I want to determine $k$ and $a$. What I have done so far is to do a linear regression (least squares) through $\log(x), \log(y)$ and determine $k$ and $a$ from its coefficients.

My problem is that since the "absolute" error is minimized for the "log-log data", what is minimized when you look at the original data is the quotient

$$\frac{y}{y_\mathrm{reg}}$$

This leads to large absolute error for large values of $y$. Is there any way to make a "power-law regression" that minimizes the actual "absolute" error? Or at least does a better job at minimizing it?


Example:

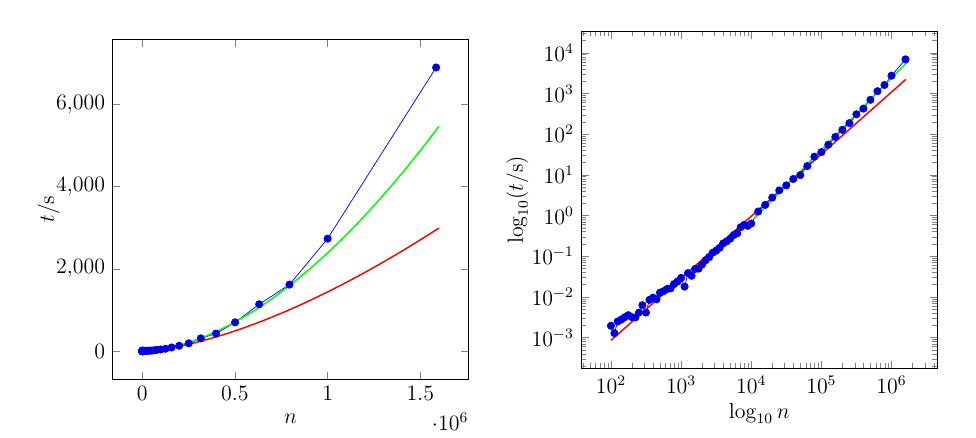
enter image description here

The red curve is fit through the whole dataset. The green curve is fit through the last 21 points only.

Here is the data for the plot. The left column are the values of $n$ ($x$-axis), the right column are the values of $t$ ($y$-axis)

1.000000000000000000e+02,1.944999820000248248e-03
1.120000000000000000e+02,1.278203080000253058e-03
1.250000000000000000e+02,2.479853309999952970e-03
1.410000000000000000e+02,2.767649050000500332e-03
1.580000000000000000e+02,3.161272610000196315e-03
1.770000000000000000e+02,3.536506440000266715e-03
1.990000000000000000e+02,3.165302929999711402e-03
2.230000000000000000e+02,3.115432719999944224e-03
2.510000000000000000e+02,4.102446610000356694e-03
2.810000000000000000e+02,6.248937529999807478e-03
3.160000000000000000e+02,4.109296799998674206e-03
3.540000000000000000e+02,8.410178100001530418e-03
3.980000000000000000e+02,9.524117600000181830e-03
4.460000000000000000e+02,8.694799099998817837e-03
5.010000000000000000e+02,1.267794469999898935e-02
5.620000000000000000e+02,1.376997950000031709e-02
6.300000000000000000e+02,1.553864030000227069e-02
7.070000000000000000e+02,1.608576049999897034e-02
7.940000000000000000e+02,2.055535920000011244e-02
8.910000000000000000e+02,2.381920090000448978e-02
1.000000000000000000e+03,2.922614199999884477e-02
1.122000000000000000e+03,1.785056299999610019e-02
1.258000000000000000e+03,3.823622889999569313e-02
1.412000000000000000e+03,3.297452850000013452e-02
1.584000000000000000e+03,4.841355780000071440e-02
1.778000000000000000e+03,4.927822640000271981e-02
1.995000000000000000e+03,6.248602919999939054e-02
2.238000000000000000e+03,7.927740400003813193e-02
2.511000000000000000e+03,9.425949999996419137e-02
2.818000000000000000e+03,1.212073290000148518e-01
3.162000000000000000e+03,1.363937510000141629e-01
3.548000000000000000e+03,1.598689289999697394e-01
3.981000000000000000e+03,2.055201890000262210e-01
4.466000000000000000e+03,2.308686839999722906e-01
5.011000000000000000e+03,2.683506760000113900e-01
5.623000000000000000e+03,3.307920660000149837e-01
6.309000000000000000e+03,3.641307770000139499e-01
7.079000000000000000e+03,5.151283440000042901e-01
7.943000000000000000e+03,5.910637860000065302e-01
8.912000000000000000e+03,5.568920769999863296e-01
1.000000000000000000e+04,6.339683309999486482e-01
1.258900000000000000e+04,1.250584726999989016e+00
1.584800000000000000e+04,1.820368430999963039e+00
1.995200000000000000e+04,2.750779816999994409e+00
2.511800000000000000e+04,4.136365994000016144e+00
3.162200000000000000e+04,5.498797844000023360e+00
3.981000000000000000e+04,7.895301083999981984e+00
5.011800000000000000e+04,9.843239714999981516e+00
6.309500000000000000e+04,1.641506008199996813e+01
7.943200000000000000e+04,2.786652209900000798e+01
1.000000000000000000e+05,3.607965075100003105e+01
1.258920000000000000e+05,5.501840400599996883e+01
1.584890000000000000e+05,8.544515980200003469e+01
1.995260000000000000e+05,1.273598972439999670e+02
2.511880000000000000e+05,1.870695913819999987e+02
3.162270000000000000e+05,3.076423412130000088e+02
3.981070000000000000e+05,4.243025571930002116e+02
5.011870000000000000e+05,6.972544795499998145e+02
6.309570000000000000e+05,1.137165088436000133e+03
7.943280000000000000e+05,1.615926472178005497e+03
1.000000000000000000e+06,2.734825116088002687e+03
1.584893000000000000e+06,6.900561992643000849e+03

(sorry for the messy scientific notation)

$\endgroup$
3
  • 2
    $\begingroup$ Be aware that the help center says "Please note, however, that cross-posting is not encouraged on SE sites. Choose one best location to post your question. Later, if it proves better suited on another site, it can be migrated." $\endgroup$
    – Glen_b
    Commented Oct 30, 2016 at 8:01
  • 2
    $\begingroup$ it's quite plain from your plot that a single power law does not fit these data. You may find some value in the other power law questions on site. It may also be worth your time to read the paper by Aaron Clauset, Cosma Rohilla Shalizi, M. E. J. Newman (2009), "Power-law distributions in empirical data," SIAM Review 51, 661-703 (see the arXiv version here arXiv:0706.1062v2); and this post by Shalizi. $\endgroup$
    – Glen_b
    Commented Oct 30, 2016 at 8:06
  • 2
    $\begingroup$ Some relevant information here $\endgroup$
    – Glen_b
    Commented Oct 30, 2016 at 8:16

2 Answers 2

6
$\begingroup$

If you want equal error-variance on every observation in the untransformed scale, you can use nonlinear least squares.

(This will often not be suitable; errors over many orders of magnitude are rarely constant in size.)

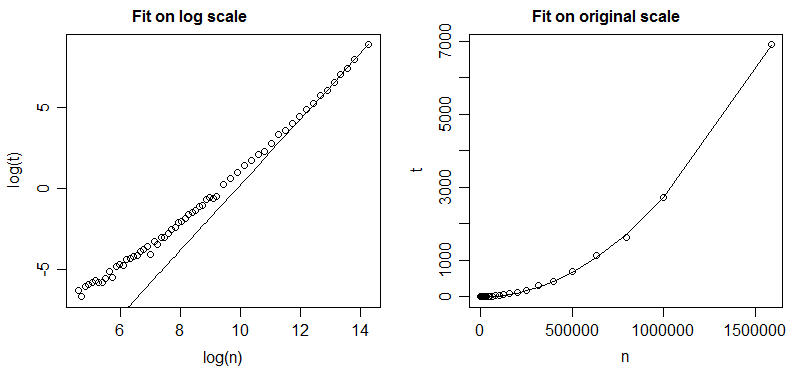
If we go ahead and use it nonetheless, we get a much closer fit to the later values:

Plot of nonlinear least squares fit

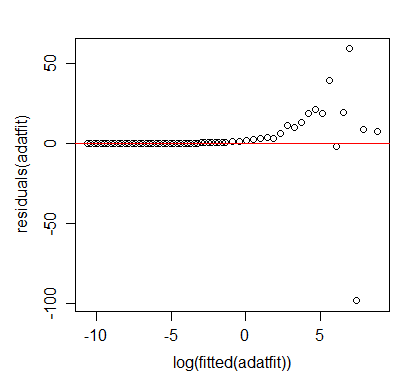
And if we examine residuals we can see that my warning above is entirely well-founded:

Residual plot against log(fitted) for above model

This shows that the variability is not constant on the original scale (and that the fit of this single power curve doesn't fit all that well at the high end either, since there's distinct curvature in the third quarter of range of the log values on the x-scale -- between about 0 and 5 on the x-axis above). The variability is nearer to constant in the log scale (though it's a little more variable in relative terms at low values than high ones there).

What it would be best to do here depends on what you're trying to achieve.

$\endgroup$
3
  • $\begingroup$ In this case, a fit that is better for the largest $y$-values might be appropriate, as we dont matter so much the running time when it is low ... $\endgroup$ Commented Oct 30, 2016 at 12:07
  • 1
    $\begingroup$ @kjetilbhalvorsen There's better ways to achieve that, but the fact that the model doesn't fit is a clear warning that if interest was to predict even slightly outside the range of the data, the predictions will be too low, perhaps dramatically so. The fit to only the last 21 points still doesn't fit the curvature within that part of the data. $\endgroup$
    – Glen_b
    Commented Oct 30, 2016 at 13:40
  • $\begingroup$ A comment about running times on real machines; often the bigger problems will see a substantial change in what would otherwise be close to a power law because you can start seeing a lot of artifacts from the impact on memory usage -- swapping stuff that was being kept in memory out to disk and so on, which can slow things down. Meanwhile at lower size problems often the asymptotic behavior you want to pick up is impacted by the "less slow" parts (e.g if there's an $O(n^2)$ component and an $O(n\text{ lg } n)$ component with a large constant that second term might have a substantive impact) $\endgroup$
    – Glen_b
    Commented Apr 28 at 22:24
6
$\begingroup$

A paper by Lin and Tegmark nicely summarizes the reasons why lognormal and/or markov process distributions fail to fit data displaying critical, power law behaviors... https://ai2-s2-pdfs.s3.amazonaws.com/5ba0/3a03d844f10d7b4861d3b116818afe2b75f2.pdf . As they note, "Markov processes...fail epically by predicting exponentially decaying mutual information..." Their solution and recommendation is to employ deep learning neural networks such as long-short-term memory (LSTM) models.

Being old school and neither conversant nor comfortable with NNs or LSTMs, I will give a tip of the hat to @glen_b's nonlinear approach. However, I prefer more tractable and readily accessible workarounds such as value-based quantile regression. Having used this approach on heavy tailed insurance claims, I know that it can provide a much better fit to the tails than more traditional methods, including multiplicative, log-log models. The modest challenge in using QR is finding the appropriate quantile around which to base one's model(s). Typically, this is much greater than the median. That said, I don't want to oversell this method as there remained significant lack of fit in the most extreme values of the tail.

Hyndman, et al (http://robjhyndman.com/papers/sig-alternate.pdf), propose an alternative QR they term boosting additive quantile regression. Their approach builds models across a full range or grid of quantiles, producing probabilistic estimates or forecasts which can be evaluated with any one of the extreme value distributions, e.g., Cauchy, Levy-stable, whatever. I have yet to employ their method but it seems promising.

Another approach to extreme value modeling is known as POT or peak over threshold models. This involves setting a threshold or cut-off for an empirical distribution of values and modeling only the largest values that fall above the cutoff based on a GEV or generalized extreme value distribution. The advantage to this approach is that any possible future extreme value can be calibrated or located based on the parameters from the model. However, the method has the obvious disadvantage that one is not using the full PDF.

Finally, in a 2013 paper, J.P. Bouchaud proposes the RFIM (random field ising model) for modeling complex information displaying criticality and heavy tailed behaviors such as herding, trends, avalanches, and so on. Bouchaud falls in a class of polymaths that should include the likes of Mandelbrot, Shannon, Tukey, Turing, etc. I can claim to be highly intrigued by his discussion while, at the same time, being intimidated by the rigors involved with implementing his suggestions. https://www.researchgate.net/profile/Jean-Philippe_Bouchaud/publication/230788728_Crises_and_Collective_Socio-Economic_Phenomena_Simple_Models_and_Challenges/links/5682d40008ae051f9aee7ee9.pdf?inViewer=0&pdfJsDownload=0&origin=publication_detail

$\endgroup$

Your Answer

By clicking “Post Your Answer”, you agree to our terms of service and acknowledge you have read our privacy policy.

Not the answer you're looking for? Browse other questions tagged or ask your own question.