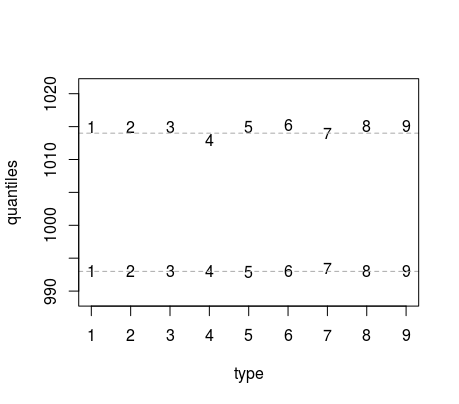
Given the following data:
972, 975, 985, 993, 993, 995, 998, 1001, 1004, 1007, 1008, 1009, 1011, 1015, 1016, 1020, 1022, 1032
I calculate the lower quartile as follows:
Number of values: 18, Number of 'gaps': 17.
Lower quartile is at 17/4 + 1 = 5.25th value. 5.25th value is 993 + (995 - 993) x 0.25 = 993.5
Upper quartile is at 3 x 17/4 + 1 = 13.75th value. 13.75th value is 1011 + (1015 - 1011) x 0.75 = 1014
Both the Excel QUARTILE function and the R quantile function agree with me. However the book I am using (Understanding Statistics by Graham Upton and Ian Cook) give different answers (993 and 1015 respectively). I'm confused. Which is correct?

