3
$\begingroup$

I'm wondering what the best way to generate prediction intervals from a linear model when there is known heteroscedastic AND the heteroscedasticity is predictable.

Consider the following toy example:

   #generate sample data
   sample_df <- data.frame(
        response = c(
            rnorm(50,100,20),
            rnorm(50,20,5)
        ),
        group = c(
            rep("A", 50),
            rep("B", 50)
        )
    )

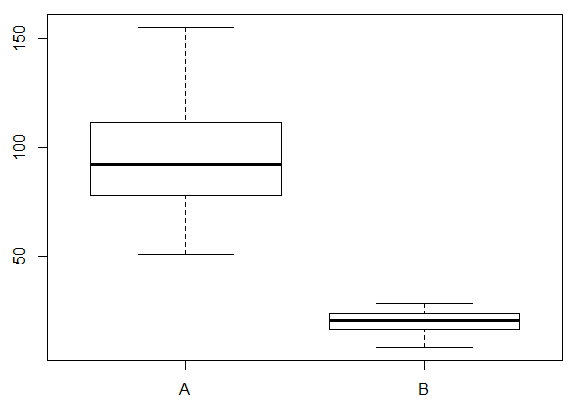
    #Boxplot
    boxplot(response~group, data=sample_df)

Sample data

An ordinary linear model will give fine spot estimates/predictions for groups A and B, but confidence and prediction intervals will be inappropriate.

Having a look at similar questions on this topic, I've ascertained that gls() from the nlme package can be used to create a model for this situation, but I can't seem to work out how to (easily) generate confidence and prediction intervals from it.

Would this be an appropriate model fit?

gls_1 <- gls(
    response ~ group,
    data = sample_df,
    weights = varIdent(form = ~1|group)
)

Given this model, how would one generate the desired intervals?

$\endgroup$

2 Answers 2

3
$\begingroup$

See Frank Harrell's package rms:

gls_1 <- gls(
  response ~ group,
  data = sample_df,
  weights = varIdent(form = ~1|group)
)

coef(gls_1)
#Intercept   group=B 
#98.71842 -78.92810 
predict(gls_1, newdata = data.frame(group = c("A", "B")))
#[1] 98.71842 19.79033
#attr(,"label")
#[1] "Predicted values"

library(rms)
gls_2 <- Gls(
  response ~ group,
  data = sample_df,
  weights = varIdent(form = ~1|group),
  B = 1e3 #bootstrap
)
coef(gls_2)
#Intercept   group=B 
#98.71842 -78.92810
Predict(gls_2, group = c("A", "B"))
#group     yhat    lower     upper
#1     A 98.71842 93.50173 103.36231
#2     B 19.79033 18.41493  21.08034
#
#Response variable (y): X * Beta 
#
#Limits are 0.95 confidence limits
$\endgroup$
1
  • $\begingroup$ Thanks, this gets me halfway there. I'm guessing I'd have to do my own bootstrapping for prediction intervals though? $\endgroup$
    – dcl
    Commented Jan 19, 2017 at 0:41
2
$\begingroup$

Roland has a good answer for the CI, but for your first question ("Would this be an appropriate model fit?") I would add that you can check whether this model is more parsimonous than the standard (homogenous variance) model:

# Classic ANOVA (but using the gls function, so models can be compared)
homogenous_var <- gls(
    response ~ group,
    data = sample_df
    )
AIC(homogenous_var, gls_1)

#                df      AIC
# homogenous_var  3 798.0351
# gls_1           4 731.5957

Alternatively, you can use classic hypothesis testing:

anova(homogenous_var, gls_1)

#                Model df      AIC      BIC    logLik   Test  L.Ratio p-value
# homogenous_var     1  3 798.0351 805.7900 -396.0175                        
# gls_1              2  4 731.5957 741.9356 -361.7979 1 vs 2 68.43935  <.0001 

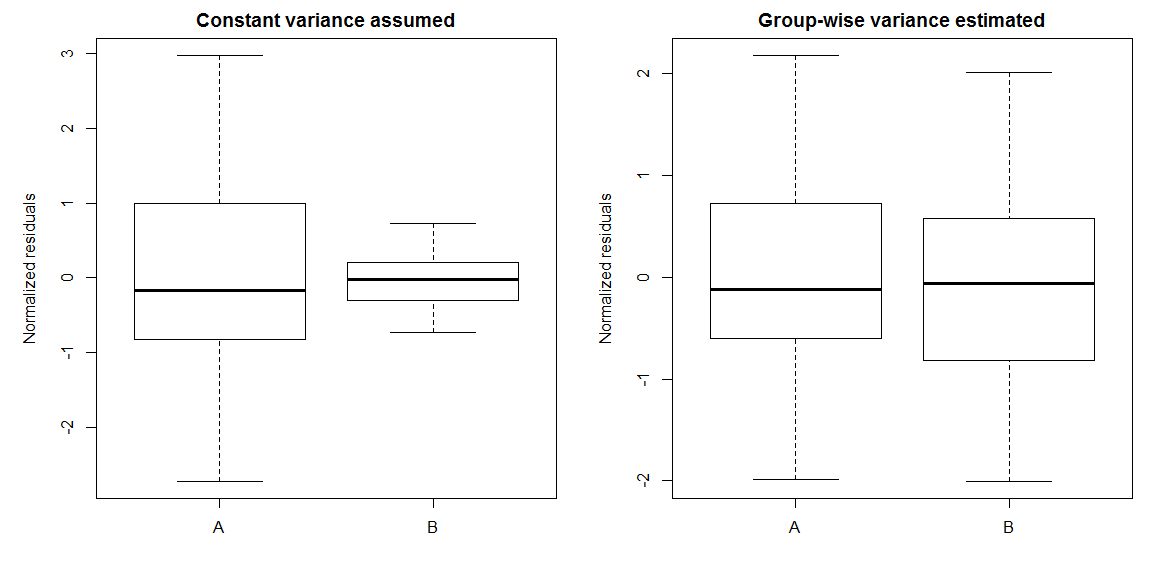
Finally, you can compare standardized residuals for the models:

windows(8,4)
par(mfrow = c(1,2), mar = c(4,5,2,1))

# Standardized residuals from anova
sample_df$homogenous_var_res <- resid(homogenous_var, type = "normalized")
boxplot(homogenous_var_res ~ group, data=sample_df, ylab = "Normalized residuals")

# Standardized residuals from GLS, different variances per group
sample_df$gls_1_res <- resid(gls_1, type = "normalized")
boxplot(gls_1_res~group, data=sample_df, ylab = "Normalized residuals")

enter image description here

$\endgroup$
0

Your Answer

By clicking “Post Your Answer”, you agree to our terms of service and acknowledge you have read our privacy policy.

Not the answer you're looking for? Browse other questions tagged or ask your own question.