2
$\begingroup$

I’d like to simulate sets of correlated random variates $X_1, X_2, \dots, X_N$ given an $N \times N$ correlation matrix, where each of the $X$'s comes from the same positively skewed distribution. What’s a technique for doing this?

As an example, how would I simulate pairs ($X_1, X_2$) where $X$ follows a lognormal distribution and cor($X_1, X_2$) = 0.7?

$\endgroup$
2
  • 1
    $\begingroup$ Simulate $(X_1,X_3)$ i.i.d., then let $X_2=X_1$ with probability $0.7$ and $X_2=X_3$ with probability $0.3$. $\endgroup$
    – Did
    Commented Feb 4, 2017 at 9:57
  • $\begingroup$ Does this post answer your question? stats.stackexchange.com/questions/154301/… $\endgroup$
    – Anthony
    Commented Feb 6, 2017 at 20:22

2 Answers 2

1
+50
$\begingroup$

Gaussian copula. Let $F$ be your favorite distribution function, log-normal or whatever. Let $\Psi$ be the target correlation matrix. Construct a Gaussian copula $Z(\Sigma) \in \mathbb{R}^n$ as follows.

  1. Draw $W \sim \mathcal{N}(0,I_n)$
  2. Let $X = \Sigma^{1/2}W$
  3. Let $Z(\Sigma) = [\Phi(X_1)\quad \ldots \quad \Phi(X_n)]$ where $\Phi$ is standard normal CDF.

Now, let's use your favorite distribution to obtain $$Y(\Sigma) = [F^{-1}(Z(\Sigma)_1) \ldots F^{-1}(Z(\Sigma)_n)]$$

Calculate the correlation of $Y(\Sigma)$ (you need to draw many $Y(\Sigma)$'s to do this..) Repeat the entire exercise until you find $\Sigma$ such that $Corr(Y(\Sigma))=\Psi$. When searching for appropriate $\Sigma$, use the fact that each non-diagonal element of $\Sigma$ has one-to-one monotone relation to the corresponding element of $Corr(Y(\Sigma))$.

$\endgroup$
0
$\begingroup$

General ideas are from here and here.

R code

  1. You first need to simulate a vector of uncorrelated Gaussian random variables, $\bf Z $

    NVariables=5
    VariableLen=1000
    Z=matrix(rnorm(NVariables*VariableLen), ncol=NVariables)
    
  2. Create covariance matrix $\Sigma$. Let all variables be correlated with neighbor as 0.5.

    Sigma=matrix(data=0, ncol=NVariables-1,nrow=NVariables-1)
    diag(Sigma)<-0.5
    Sigma=cbind(matrix(data=0,nrow=NVariables-1),Sigma)
    Sigma=rbind(Sigma,matrix(data=0,ncol=NVariables))
    diag(Sigma)<-1
    
  3. Find a square root of $\Sigma$. Cholesky decomposition is common choice

    C=chol(Sigma)
    
  4. To obtain random variables with given correlation matrix $\Sigma$ multiply $\bf C$ and $\bf Z$

    Y=Z%*%C
    
  5. Use inverse CDF method to obtain any distribution You wish. Here it is lognormal

    Ylog=qlnorm(pnorm(Y))
    

Results
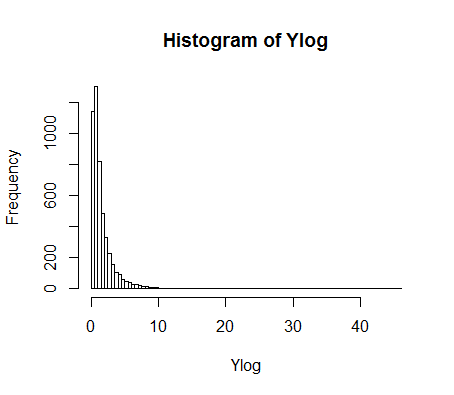
enter image description here

Correlation Matrix

            [,1]        [,2]        [,3]        [,4]        [,5]
[1,]  1.00000000  0.52817152 -0.01887624 -0.07113405 -0.05551355
[2,]  0.52817152  1.00000000  0.49392903 -0.03233261 -0.01504632
[3,] -0.01887624  0.49392903  1.00000000  0.50604908  0.04029076
[4,] -0.07113405 -0.03233261  0.50604908  1.00000000  0.49000229
[5,] -0.05551355 -0.01504632  0.04029076  0.49000229  1.00000000
$\endgroup$

Your Answer

By clicking “Post Your Answer”, you agree to our terms of service and acknowledge you have read our privacy policy.

Not the answer you're looking for? Browse other questions tagged or ask your own question.