0
$\begingroup$

I currently try to figure out if a method like elbow-method, silhouette average or gap statistic can be applied to a dissimilarity matrix. My matrix contains 100 x 100 objects and it satisfies the triangle inequality. So it has a metric but the distances are not Euclidean. My question is, can I use one of these mentioned methods or is there another method how I can determine a number of cluster with my matrix. I don't have any other data available.

I'm using R for the clustering.

Thanks a lot!

$\endgroup$
4
  • $\begingroup$ As I commented to G5W's answer, 1) it is possible to compute criterions based on SSdeviations (Gap, Calinski-Harabasz, "elbow SSwithgin", etc etc.) from (euclidean) distance matrix without having cases x variables data. 2) Besides, it is always possible to create explicitly cases x variables data out of the distance matrix by means of metric MDS and then apply those criterions to it (see e.g. stats.stackexchange.com/q/32925/3277). Actually, these two ways are internally, mathematically closely related. $\endgroup$
    – ttnphns
    Commented Sep 13, 2017 at 11:33
  • $\begingroup$ The main link for you is this: stats.stackexchange.com/q/237792/3277. See some other in my comment to G5W's answer. $\endgroup$
    – ttnphns
    Commented Sep 13, 2017 at 15:37
  • $\begingroup$ @ttnphns: My distances are unfortunately not Euclidean. But its possible to transform my matrix into an Euclidean distance matrix, right? By using an approximation by $D_{ij} \approx ||x_j - x_i||$. $\endgroup$
    – Kev Luxem
    Commented Sep 13, 2017 at 18:38
  • $\begingroup$ Gap index, SSE elbow method and other ANOVA-based indices are for euclidean distances only. (Silhouette criterion is universal.) It is possible to transform almost all dissimilarities into euclidean distance by adding a constant ("Lingoes correction"), but that means you are modifying original values (on which clustering was based). $\endgroup$
    – ttnphns
    Commented Sep 13, 2017 at 20:19

4 Answers 4

6
$\begingroup$

I interpret your question to mean that you have the dissimilarity matrix, but do not have the actual points that were used to generate the matrix. Can one use only the dissimilarity matrix (not the points) to get the number of clusters?

When you say elbow method, I understand that to mean that you will compute SSE = sum of squared distances from points within each cluster to the cluster center. Since the cluster center is in general not one of the points (and therefore not in your matrix), you cannot compute this without access to the points.

Similarly, the GAP statistic uses within cluster SSE and so cannot be computed without access to the original data.

However, silhouette uses only distances between points in the original data, no cluster centers, so all the information that you need is in your distance matrix. Here is an example of using silhouette using only the distance matrix. I start by using hclust on the distance matrix to get a hierarchical clustering

library(cluster)
DM = as.matrix(dist(ruspini))
HC = hclust(as.dist(DM), method="single")

This looks a little silly. I have converted a distance object to a full dissimilarity matrix and then converted it back to a distance object. I did this because your question asks about using a dissimilarity matrix and I wanted to start from that point. Now let's compute the average silhouette using various numbers of clusters.

## Silhouette
plot(2:10, sapply(2:10, function(i) { 
   mean(silhouette(cutree(HC, i), dmatrix=DM)[,"sil_width"]) }),
   xlab="Number of clusters", ylab="Average Silhouette", type="b", pch=20)
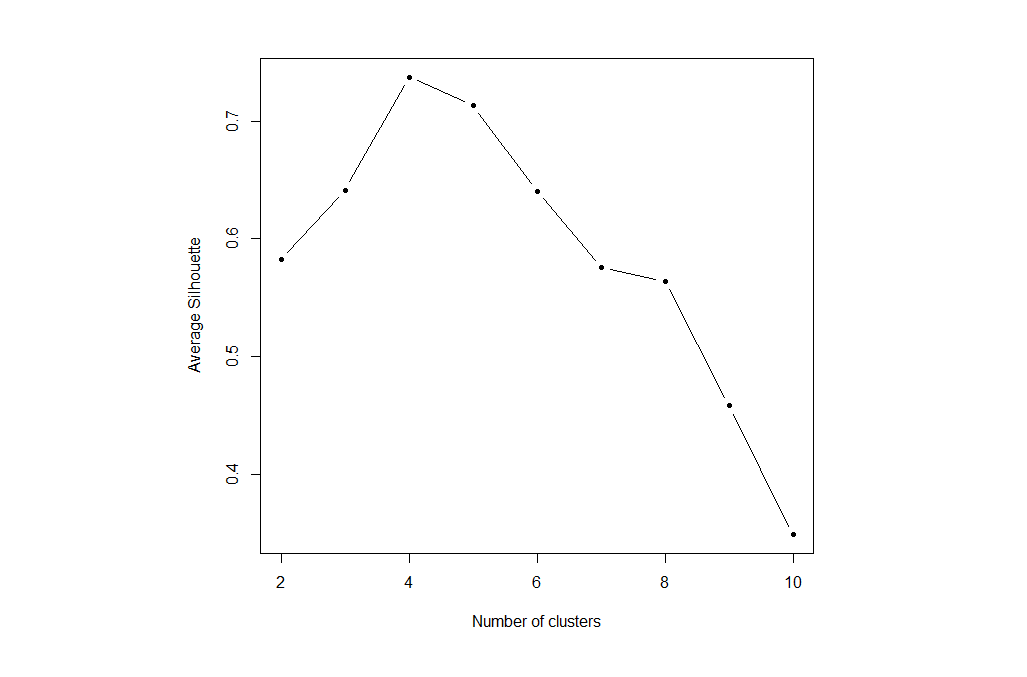
Average silhouettes

This suggests that there should be four clusters - the value with the highest silhouette.

$\endgroup$
6
  • $\begingroup$ Thanks for your answer, this is really helpful and you are interpreting my question right. I read here link and here link that is it possible to use a dissimilarity matrix for kmeans by centering the matrix and taking the eigenvalues. Somehow similar to metric multidimensional scaling. Wouldn't it be possible to use that and then feed the result into the elbow method or gap-statistic? $\endgroup$
    – Kev Luxem
    Commented Sep 13, 2017 at 3:06
  • $\begingroup$ This is mostly incorrect answer. SSwithin, SSbetween can be computed from Euclidean distance matrix, without having original cases by variables dataset. So, indices based on those quantities can be used. $\endgroup$
    – ttnphns
    Commented Sep 13, 2017 at 3:37
  • $\begingroup$ @ttnphns: Do you mean the answer of G5W is incorrect or the answers given in the links? Also, would it be possible in R to transform my dissimilarity matrix into euclidean distance matrix using the dist() function? $\endgroup$
    – Kev Luxem
    Commented Sep 13, 2017 at 4:29
  • $\begingroup$ I meant G5W answer. Sorry I'm not R user to be able to help with the language. $\endgroup$
    – ttnphns
    Commented Sep 13, 2017 at 4:34
  • $\begingroup$ G5W, SSwithin (=SSE) in a data (e.g. in each cluster) is computed from euclidean distances as said here. SSbetween cluster centroids is computed as said here. Read also this. And, all summarized in matrix notation (ready to use!) - this one. $\endgroup$
    – ttnphns
    Commented Sep 13, 2017 at 15:27
2
$\begingroup$

The statistics behind these plots can be very much misleading, and the notion of an "elbow" doesn't even appear to have a proper definition at all, it's quite subjective.

At just 100 objects, and with a similarity matrix, I would rather use the dendrogram to decide on which clusters to keep.

$\endgroup$
6
  • $\begingroup$ But dendrogram (its branches or elbow relative lengths) is actually one of all those internal eveluation indices which are "misleading" for you. In 70s, Mojena proposed 2 criterions to plot, these criterions are based directly on those dendrogram levels. Eventually, dendrogram is as good or is as misleading as those other indices. $\endgroup$
    – ttnphns
    Commented Sep 13, 2017 at 8:52
  • $\begingroup$ In contrast to the indices, the dendrogram contains (n-1) height values, and not just 1. That makes a big difference to not rely on some automatic method to summarize your entire clustering into 1 number. I'd rather study the entire dendrogram. $\endgroup$ Commented Sep 13, 2017 at 8:57
  • $\begingroup$ Sorry? n-1 values says that a range of cluster solutions could be made based on the dendrogram. For each of those solutions you as well can compute a criterion, such as Davies-Bouldin or average Silhouette or any other. In eye-analyzing an "entire dendrogram", relative lengths of elbows is the criterion, actually. $\endgroup$
    – ttnphns
    Commented Sep 13, 2017 at 9:03
  • $\begingroup$ You can even cut multiple branches at different height. So you can choose more than one merge to do, or not to do. And you don't use it as a sorted list; you look how the branches relate to all other branches. And you will be much more aware of whether this was a clear decision, or a "maybe cut here, maybe not" decision. But yes, you can consider everything that is based on numbers to be a "criterion". $\endgroup$ Commented Sep 13, 2017 at 9:13
  • $\begingroup$ In late 90s I worked out a criterion for a dendrogram incorporating much of those ideas you are saying about. And it allowed to "cut" the tree on different levels, to obtain a partition. I'm still thinking maybe one day to reconsider it and, if I find it worth, to program it. $\endgroup$
    – ttnphns
    Commented Sep 13, 2017 at 9:28
1
$\begingroup$

It is possible to use only the dissimilarity matrix for clustering (without the original points), in a way that close to Kmeans. It's called "kernel Kmeans" and is very similar to "spectral clustering". You can read: https://en.wikipedia.org/wiki/Spectral_clustering.

It is a sort of kernel method. With this way of seeing things, the dissimilarity matrix defines implicitly a non linear mapping of the original points (in a space $S$) into an infinite dimension space $L^2(S)$ called the "feature space". Kernel Kmeans is a standard Kmeans performed in this feature space. You don't really manipulate infinite dimension objects, since everything happens in the linear span of your 100 points: real dimension is 100.

To adapt the number of clusters, you can most likely use methods inspired from standard Kmeans, since it is actually one (with centres, coordinates and everything...), in the feature space.

$\endgroup$
4
  • $\begingroup$ into a higher dimension space Higher than what? $\endgroup$
    – ttnphns
    Commented Sep 13, 2017 at 11:22
  • $\begingroup$ Good point. Edited. $\endgroup$ Commented Sep 13, 2017 at 11:41
  • $\begingroup$ Thanks, Kernel expansion is an option. Note however, that the OP question does not ask about alternative clustering strategies. It asks simply and specifically how to apply some clustering criterions (such as Gap) having a distance matrix at hand. Clustering is assumed to have been done already. $\endgroup$
    – ttnphns
    Commented Sep 13, 2017 at 11:47
  • $\begingroup$ Besides, it would be nice to hear how a nonlinear kernel method will excel nonmetric MDS, for example. While your answer is at nonlinear mapping techniques. $\endgroup$
    – ttnphns
    Commented Sep 13, 2017 at 11:50
1
$\begingroup$

A scree plot should be your first indicator of the number of cluster dimensions. One way of doing this is to use multidimensional scaling (MDS) to model the distances between your observations, and then run a scree test on the eigenvalues. Your distance matrix will fit very nicely into a number of different clustering algorithms, though I have used MDS very successfully under these conditions. R has a number of libraries and instructions to support MDS, such as $cmdscale$. The book by Hothorn and Everitt also contains a straightforward practical application of MDS in R.

$\endgroup$
5
  • $\begingroup$ Hi, thanks for your answer. I know that I can use with my matrix hierarchical cluster algorithm as well as PAM (partitioning around medoids). I also did a MDS using the cmdscale() function in R and calculated the distances by using dist() on my dissimilarity matrix. But my question is rather if I can use classical tools like the elbow method? $\endgroup$
    – Kev Luxem
    Commented Sep 13, 2017 at 0:30
  • $\begingroup$ In that case, you might also be interested in the discussion following this question. $\endgroup$
    – Grosvenor
    Commented Sep 13, 2017 at 1:20
  • $\begingroup$ I'm aware of what the elbow method is ;) my problem is more if I'm allowed to read in a dissimilarity matrix into this method $\endgroup$
    – Kev Luxem
    Commented Sep 13, 2017 at 2:07
  • $\begingroup$ The link to the book is broken $\endgroup$
    – Krrr
    Commented Sep 13, 2017 at 8:25
  • $\begingroup$ I fixed the link to the book. $\endgroup$
    – Grosvenor
    Commented Sep 15, 2017 at 1:16

Your Answer

By clicking “Post Your Answer”, you agree to our terms of service and acknowledge you have read our privacy policy.

Not the answer you're looking for? Browse other questions tagged or ask your own question.