I have the time series data. The mean and maximum value, standard deviation at every minute (60s) is given. However, I want to intrapolate it as I want the data of each second. Is there any way to do this ?
-
$\begingroup$ You could intrapolate the per-second values using the mean of the corresponding minute and (assuming the error is normally distributed) add/substract a random normal draw times the standard deviation ($N(0,1) * SD$). However, as randomness plays a part, you might have a (un)lucky draw. As such, this is alike imputation of missing values. In these cases it is recommended to perform the replacement of missing values multiple times, while pooling along certain rules using the variation between estimates to account for guessing the missing values (i.e. multiple imputation). $\endgroup$– IWSCommented Oct 31, 2017 at 12:34
-
$\begingroup$ Can you please provide more information about the dataset? Specifically, what are the observations (and their units)? $\endgroup$– JoshCommented Oct 31, 2017 at 15:54
1 Answer
If you could provide an example dataset would be good.
If I understand your question correctly, you have the mean value, standard deviation and maximum value for every minute and want to find an optimal way to interpolate to second data using this information?
Do you need to include the information on standard deviation you have? If not, you can use a simple interpolation, such as with Scipy.
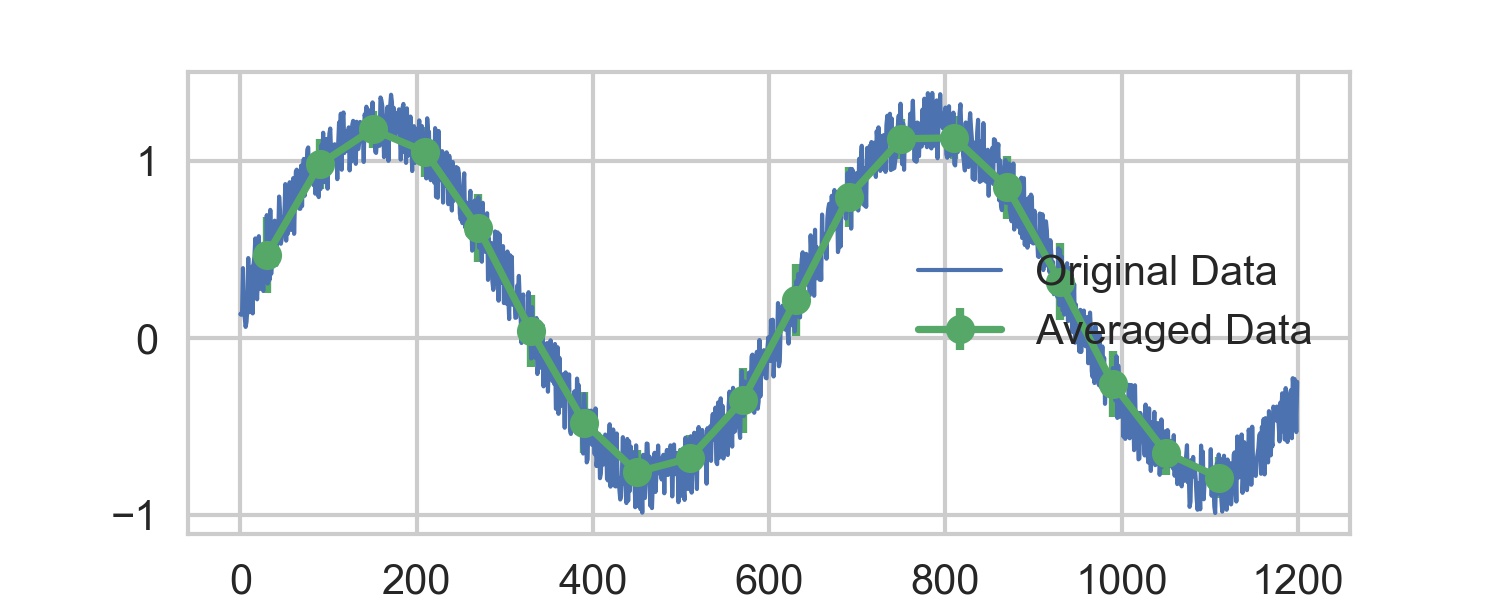
Let's assume this is your original data set and the resulting averaged data:
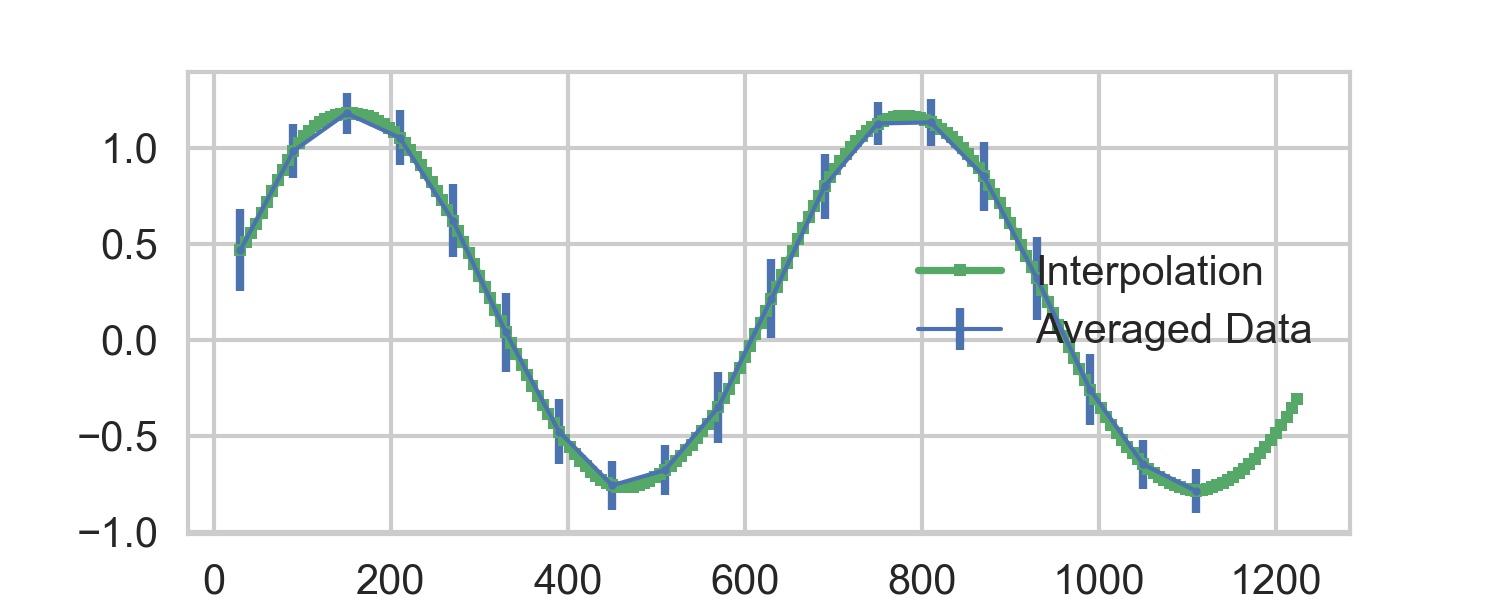
 then interpolating using only the mean values will result in this
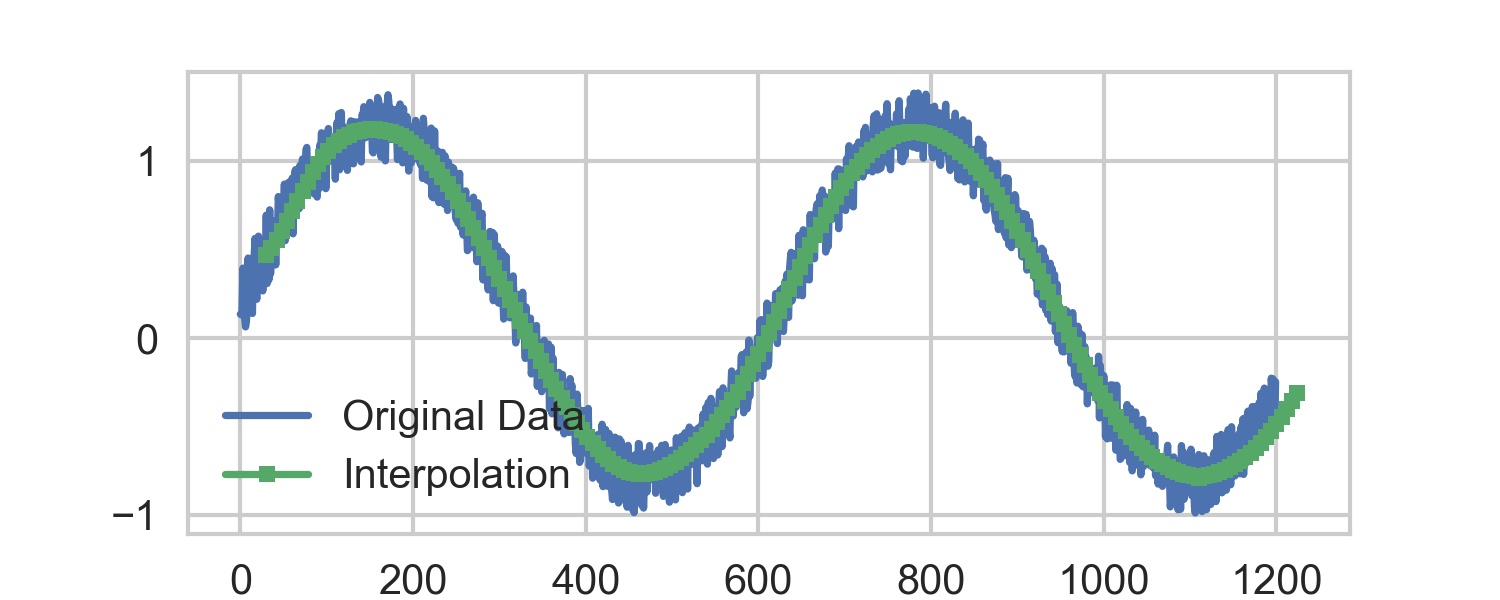
 looking at it on the original data

The code for this is below.
If you provide more information on what kind of data you have and what you want to use it for, a more specific answer is possible.
    FIGSIZE=(10,4)
    import matplotlib.pylab as plt
    import seaborn as sns
    sns.set_style("whitegrid")
    plt.close('all')

    import numpy as np
    import scipy.signal

    #Create an example dataset
    T = 100 #Period
    t = np.arange(1200)
    y = np.sin(t/T) + 0.4*np.random.rand(len(t))

    plt.figure(figsize=FIGSIZE)
    plt.plot(t,y, lw=1, label='Original Data')
    plt.xlabel('Time')

    #Average data
    MINS = int(np.max(t)/60)
    tm=np.zeros(MINS); ym=np.zeros(MINS); ysd=np.zeros(MINS);         ymax=np.zeros(MINS)
    for ii in range(MINS):
        st = ii*60
        et = (ii+1)*60
        tempy = y[(t>st) & (t<et)]

        tm[ii] = ii+1
        ym[ii] = np.mean(tempy)
        ysd[ii] = np.std(tempy)
        ymax[ii] = np.max(tempy)

    plt.errorbar(tm*60 - 30, ym, yerr=ysd, marker='o', linestyle='-', capsize=5,
                 elinewidth=2, label='Averaged Data')
    plt.legend(loc='best')
    plt.savefig('reduceddata.jpg', dpi=300)

    #From http://scipy-cookbook.readthedocs.io/items/Interpolation.html

    from scipy.signal import cspline1d, cspline1d_eval

    newt = np.arange(0,20,0.1)
    cj = cspline1d(ym)
    newy = cspline1d_eval(cj, newt, dx=1,x0=0)
    plt.figure(figsize=FIGSIZE)
    plt.errorbar(tm*60 - 30, ym, yerr=ysd, marker='o', linestyle='-', markersize=2,
                 lw=1, capsize=5, elinewidth=2, label='Averaged Data')

    plt.plot(newt*60+30, newy, 's-', markersize=3, label='Interpolation')
    plt.xlabel('Time')
    plt.show()
    plt.legend(loc='best')
    plt.savefig('interpolation.jpg', dpi=300)

    plt.figure(figsize=FIGSIZE)
    plt.plot(t, y, label='Original Data')
    plt.plot(newt*60+30, newy, 's-', markersize=4, label='Interpolation')
    plt.xlabel('Time')
    plt.legend(loc='best')
    plt.show()
    plt.savefig('interpolation2.jpg', dpi=300)
-
$\begingroup$ Where does this procedure exploit the information contained in the minute-by-minute standard deviations, minima, and maxima? If it doesn't use that information--which is not redundant--then it cannot be an admissible procedure: improvement (possibly great improvement) ought to be possible. $\endgroup$– whuber ♦Commented Oct 31, 2017 at 15:04
-
1$\begingroup$ Yes, this only uses the mean values and ignores the standard deviation and maximum values. The question isn't explicit what the aim is so I thought I would submit a suboptimal solution that achieves something in the case that is what @Taru wanted. $\endgroup$– Edgar HCommented Oct 31, 2017 at 15:25
