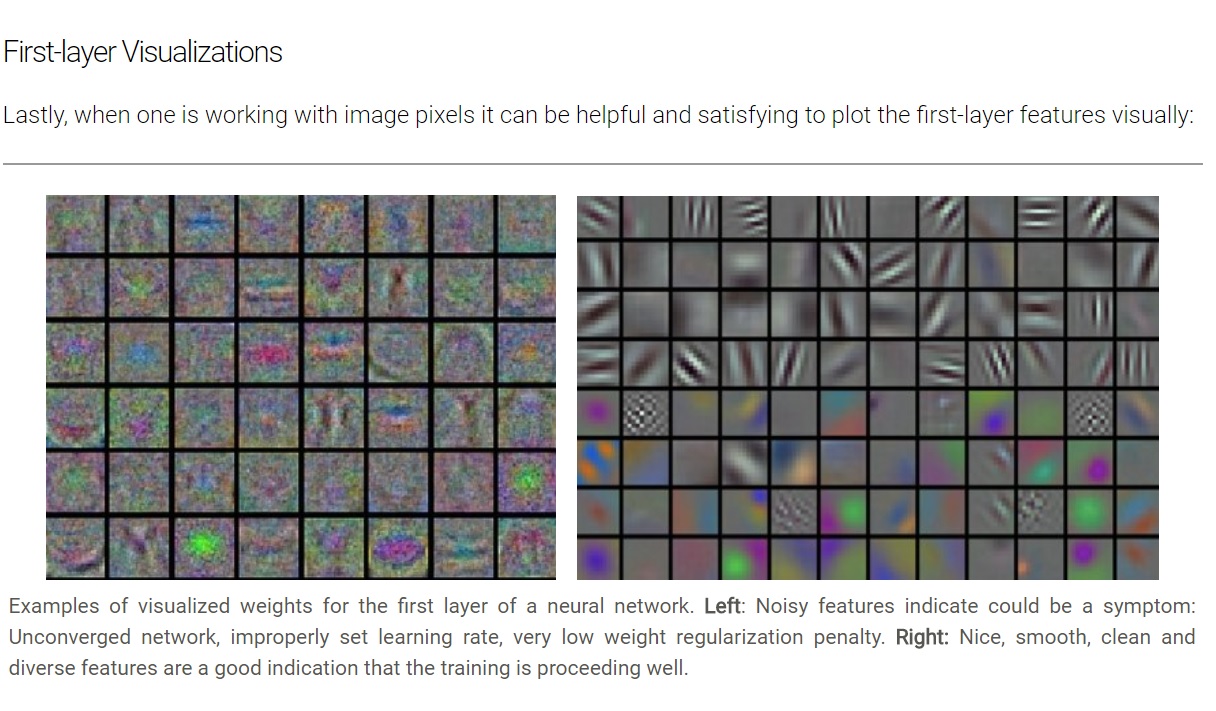
I am reading the lectures on "Convolutional Neural Networks for Visual Recognition", and in this lecture they deal with first layer visualization. As you can see in the figure below- this figure supposed to visualize the weights of the first layer of a (fully connected) neural network. Could someone explain how exactly we get these visualizations from the weight matrix W? For example, if the input is of dimension m, and the first layer is of dimension n, the weight matrix has m*n parameters. How do we transform them into the squares depicted in the figure, and how do we decide to fix the intensities?
2 Answers
The key to understanding this plot is on page 1 of this course:
An example neural network would instead compute s=$W_2$max(0,$W_1$x). Here, $W_1$ could be, for example, a [100x3072] matrix transforming the image into a 100-dimensional intermediate vector.
If the image is from CIFAR-10, then it's vectorized into a column vector $x$ with 3017 elements. Once you apply the first layer matrix of weights $W_1$ it becomes a column vector $W_1x$ that has 100 elements. Next, you apply activation $\max(0,.)$ and draw it as a 10x10 image. That would be an image of the first layer.
However, I think the actual picture wasn't of this kind of dense network, but was from the filters of the CNN. Each cell appears like a filter output to me on this picture. For instance VGG-16 architecture has 64 filters each producing 224x224 output after convolution. So you can directly draw this as 224x24 image. I think that's what's going on in this picture.
You have 8x12 filters on the right and 6x8 on the left. On the left the "picture" created by filters is not just noisy, but it doesn't seem to be different between different neurons. On the right you see how each picture is quite distinct, so the left top cell is detecting the diagonal line patterns. Those who work with images will be able to tell you which exactly filter (convolution) does that.
I'm not 100% sure but I think that for each Neuron, they create an image by just multiplying the input pixels by their weights leading to that particular neuron. You'll get results exceeding the values of what a pixel can be (0-255) and also get negative numbers, so you'll have to rescale the results before actually displaying it as an image.

