10
$\begingroup$

R seems to be able to output nice summary plots from the bugs and jags objects generated by the functions R2WinBUGS::bugs and R2jags:jags.

However, I am using the rjags package. When I try to plot the results of the function rjags::coda.samples using R2WinBUGS::plot.mcmc.list the results are diagnostic plots (parameter density, chain time series, autocorrelation) for each parameter.

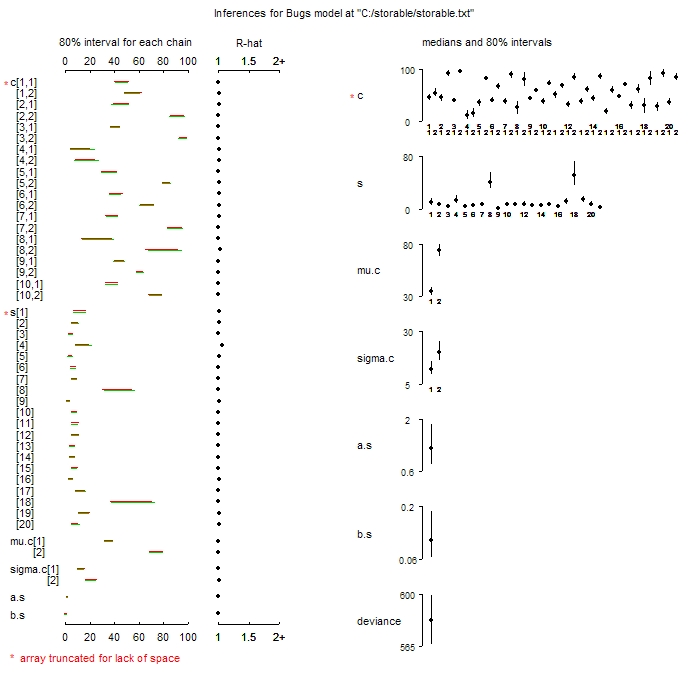
Below is the type of plot that I would like to produce, from Andrew Gelman's tutorial "Running WinBuugs and OpenBugs from R". These were produced by using the plot.pugs.

The problem is that plot.bugs takes a bugs object as an argument, while plot.mcmc.list takes the output of coda.samples.

Here is an example (from the coda.samples):

 library(rjags)
 data(LINE)
 LINE$recompile()
 LINE.out <- coda.samples(LINE, c("alpha","beta","sigma"), n.iter=1000)
 plot(LINE.out)

What I need is either

  • a way to generate a similar, information-rich, one-page summary plot similar to the one produced by plot.bugs
  • a function that will convert LINE.out to a bugs object or

enter image description here

$\endgroup$

2 Answers 2

3
+50
$\begingroup$

Since there are no answers, I will at least post what I have gotten so far:

The as.bugs.array function in the R2WinBUGS package was created for this purpose. According to the documentation (?as.bugs.array):

Function converting results from Markov chain simulations, that might not be from BUGS, to bugs object. Used mainly to display results with plot.bugs.

Thus, it is possible to obtain a plot from LINE.out in your example, although it does not plot the correct variables:

plot(as.bugs.array(sims.array = as.array(LINE.out)))        

It will take a little bit more work to determine the correct way to transform the LINE.out, and the LINE.samples object from example(jags.samples) may be an easier place to start.

$\endgroup$
0
$\begingroup$

The following seems to work for me:

require(R2jags)
m <-jags(data=d,inits=i,pars,n.iter=1000,n.chains=3,model.file="foo.txt",DIC=F)
m <- autojags(m)
plot(m)

Here is a reproducible example:

example(jags)
plot(jagsfit)
$\endgroup$
1
  • 1
    $\begingroup$ That is a helpful clue, but doesn't solve the problem of starting with an mcmc.list (as far as I can tell). $\endgroup$ Commented Jul 19, 2012 at 17:51

Not the answer you're looking for? Browse other questions tagged or ask your own question.