9
$\begingroup$

My question is very similar to a question on stackoverflow and this one on crossvalidated but I would like to have more details.

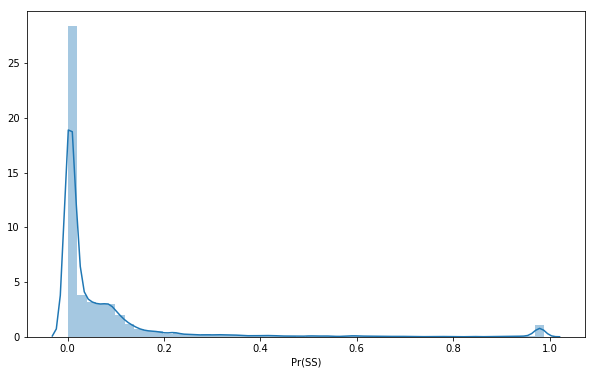
I have some data and I want to check the amount of error I would have if I assume that these data follow an exponential/Poisson distribution (I'd like to have the parameters estimate if possible).

On the X axis I have a measure of probability (it is often close to 0 and rarely close to 1).

Data

Could you help me?

$\endgroup$
2
  • $\begingroup$ You can visualise the discrepancy with a Q-Q plot. To quantify it, you can use a Kolmogorov-Smirnoff test. Python implementation you may have to work out for yourself. $\endgroup$
    – Zhubarb
    Commented Feb 15, 2018 at 14:11
  • $\begingroup$ Hi Berkmeister! Thank you for the answer. Can you try to explain it using more details? Many thanks. $\endgroup$ Commented Feb 19, 2018 at 7:19

2 Answers 2

11
$\begingroup$

One way to do what you're trying to do, is to compare your data with the hypothesized distribution (Exponential, Poisson, ..) and see if you can make any conclusions based on that comparison.

Here is one approach:

  1. Figure out which distribution you want to compare against.
  2. For that distribution, identify what the relevant parameters are that completely describe that distribution.
    • Usually it's the mean and variance. In the case of Poisson, the mean equals the variance so you only have 1 parameter to estimate, $\lambda$.
  3. Use your own data to estimate that parameter.
    • For the Poisson, take the mean of your data. That will be the mean ($\lambda$) of the Poisson that you generate.
  4. Compare the generated values of the Poisson distribution to the values of your actual data.
    • Usually compare means find the distance between the distribution. You can look up Kullback-Leiber divergence.
    • A potentially simpler method would be to compare the distance between each point generated by your data and the corresponding point on the Poisson distribution.
    • To see if the difference is large enough to be statistically significant (and therefore you can make some determination on the distribution of your data) you can run a significant test, as was mentioned in the comments. Look up KS-test for more information. This method has flaws so make sure you understand what it's doing.
    • If you don't understand significance testing, I recommend searching this forum for more information. There. Is. A lot.
  5. Check out scipy.stats.kstest for implementation details in Python.
$\endgroup$
1
  • 1
    $\begingroup$ The KS-test is not the best idea! From the scipy.stats.kstest documentation: "The KS test is only valid for continuous distributions". Therefore I'd rather recommend the tests suggested in stats.stackexchange.com/questions/1174/… $\endgroup$
    – Jojo
    Commented Sep 21, 2018 at 15:21
0
$\begingroup$

seems like this is what you were looking for
https://nolanbconaway.github.io/blog/2019/poisson-etest
https://github.com/nolanbconaway/poisson-etest

$\endgroup$
1
  • 1
    $\begingroup$ Welcome to Stats.SE. Can you please edit you answer to expand it, in order to include the main points of the link you provide? It will be more helpful both for people searching in this site and in case the link breaks. By the way, take the opportunity to take the Tour, if you haven't done it already. See also some tips on How to Answer, on formatting help and on writing down equations using LaTeX / MathJax. $\endgroup$ Commented Oct 1, 2019 at 11:04

Your Answer

By clicking “Post Your Answer”, you agree to our terms of service and acknowledge you have read our privacy policy.

Not the answer you're looking for? Browse other questions tagged or ask your own question.