I simulated some toy data of students taking a test. Each question in the test fell into one of four categories (which I called "concepts"), and each student had an "ability" for each of those four categories, which was a probability to get a question in that category right. The I used this setup to simulate a class of 250 students responding to a 30-question test.*
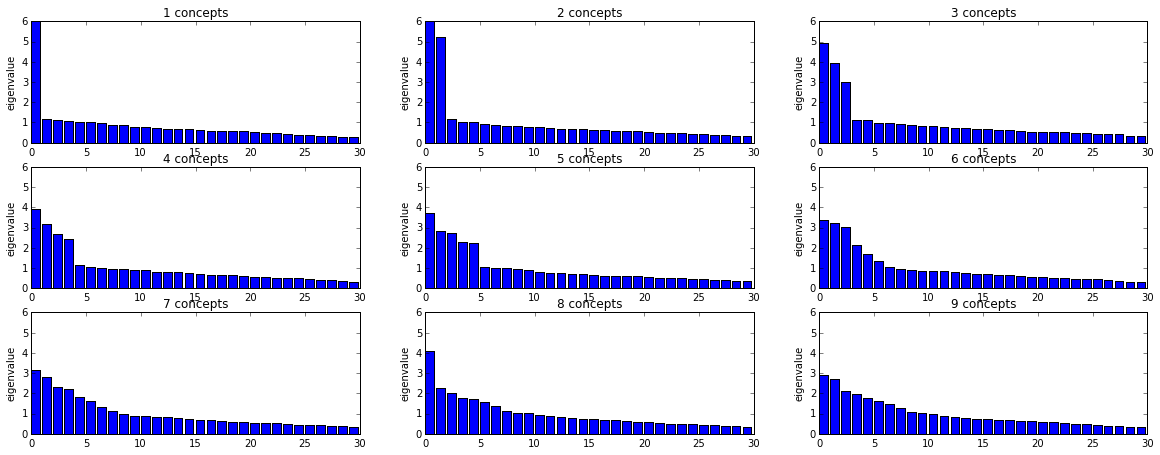
Then I ran the results through a factor analysis. As expected, I saw four large eigenvalues and 26 small ones on the scree plot. I repeated this with the same parameters except changing the number of categories, and as expected, the number of eigenvectors matched the number categories (and, after some rotation, the questions were mapped correctly to the categories as well).
Here are some scree plots of these results:
Up to four or five categories, there's a very clear drop-off in the eigenvalues, and by simulating a larger sample size, I can push this up to more categories.
My question is: how realistic is it to expect to find such clean results in any sort of real data? When I look at real test results I have on hand and do a factor analysis, the scree plots just die away basically smoothly. I can choose how many eigenvalues are significant based on some standardized criterion (e.g. eigenvalue >1), but in the example where I simulated the data, I know that I'm choosing the correct number of eigenvalues, and it's obvious. Is that ever realistically the case for actual data?
*student abilities in each category were chosen uniformly at random from 0 to 1

