Hierarchical clustering can be represented by a dendrogram. Cutting a dendrogram at a certain level gives a set of clusters. Cutting at another level gives another set of clusters. How would you pick where to cut the dendrogram? Is there something we could consider an optimal point? If I look at a dendrogram across time as it changes, should I cut at the same point?
7 Answers
There is no definitive answer since cluster analysis is essentially an exploratory approach; the interpretation of the resulting hierarchical structure is context-dependent and often several solutions are equally good from a theoretical point of view.
Several clues were given in a related question, What stop-criteria for agglomerative hierarchical clustering are used in practice? I generally use visual criteria, e.g. silhouette plots, and some kind of numerical criteria, like Dunn’s validity index, Hubert's gamma, G2/G3 coefficient, or the corrected Rand index. Basically, we want to know how well the original distance matrix is approximated in the cluster space, so a measure of the cophenetic correlation is also useful. I also use k-means, with several starting values, and the gap statistic (mirror) to determine the number of clusters that minimize the within-SS. The concordance with Ward hierarchical clustering gives an idea of the stability of the cluster solution (You can use matchClasses() in the e1071 package for that).
You will find useful resources in the CRAN Task View Cluster, including pvclust, fpc, clv, among others. Also worth to give a try is the clValid package (described in the Journal of Statistical Software).
Now, if your clusters change over time, this is a bit more tricky; why choosing the first cluster-solution rather than another? Do you expect that some individuals move from one cluster to another as a result of an underlying process evolving with time?
There are some measure that try to match clusters that have a maximum absolute or relative overlap, as was suggested to you in your preceding question. Look at Comparing Clusterings - An Overview from Wagner and Wagner.
There isn't really an answer. It's somewhere between 1 and N.
However, you can think about it from a profit perspective.
For example, in marketing one uses segmentation, which is much like clustering.
A message (an advertisement or letter, say) that is tailored for each individual will have the highest response rate. A generic message tailored to the average will have the lowest response rate. Having say three messages tailored to three segments will be somewhere in between. This is the revenue side.
A message that is tailored to each individual will have the highest cost. A generic message tailored to the average will have the lowest cost. Three messages tailored to three segments will be somewhere in between.
Say paying a writer to write a custom message costs 1000, two cost 2000 and so on.
Say by using one message, your revenue will be 5000. If you segmented your customers into 2 segments, and wrote tailored messages to each segment, your response rate will be higher. Say revenues are now 7500. With three segments, a slightly higher response rate, and your revenues are 9000. One more segment, and you're at 9500.
To maximize profit, keep segmenting until the marginal revenue from segmenting equals the marginal cost of segmenting. In this example, you would use three segments to maximize profit.
Segments  Revenue  Cost  Profit
1         5000     1000  4000
2         7500     2000  5500
3         9000     3000  6000
4         9500     4000  5500
-
1$\begingroup$ This is an interesting perspective! $\endgroup$– Andi FCommented Dec 24, 2011 at 18:48
Perhaps one of the simplest methods would be a graphical representation in which the x-axis is the number of groups and the y-axis any evaluation metric as the distance or the similarity. In that plot you usually can observe two differentiated regions, being the x-axis value at the 'knee' of the line the 'optimal' number of cluster.
There are also some statistics that could hepl on this task: Hubert' gamma, pseudo-t², pseudo-F or cubic clustering criteria (CCC) among others.
-
$\begingroup$ I am in agree with chl. Cluster analyses are exploratory approaches and the interpretation of results, for this particular case the optimal number of clusters, depends on your context. For example, in my work is common to used cluster analyses to classify individuals based on several characteristics and sometimes the number of clusters is preset. In this case, our objective is to find the set of classificatory variables that best distinguishes the individuals belonging to different clusters. $\endgroup$ Commented Oct 18, 2010 at 7:16
There is also "Clustergram: visualization and diagnostics for cluster analysis" (with R code)
Not really an answer, but another interesting idea for the toolbox.
In hierarchical clustering the number of output partitions is not just the horizontal cuts, but also the non horizontal cuts which decides the final clustering. Thus this can be seen as a third criterion aside the 1. distance metric and 2. Linkage criterion. http://en.wikipedia.org/wiki/Hierarchical_clustering
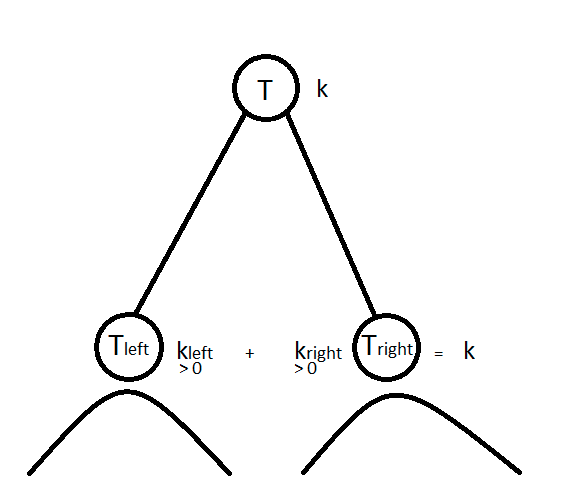
The criterion you have mentioned is a 3rd kind which is a sort of optimization constraint on the set of partitions in the hierarchy. This is formally presented in this paper and examples of segmentation are given!
Some academic paper is giving a precise answer to that problem, under some separation assumptions (stability/noise resilience) on the clusters of the flat partition.
The coarse idea of the paper solution is to extract the flat partition by cutting at different levels in the dendrogram. Say you want to minimize intra-cluster variance (that is your optimization objective), then you can formulate the problem as a dynamic programming problem: to minimize the objective function, should I cut here? or not? and you traverse the tree recursively looking for the best cuts giving you k clusters with the smallest objective function value (intra-variance or something else).
The paper (for more details):
I have implemented its approach (essentially dynamic programming) in my blog, and detailed the steps, if it can help:
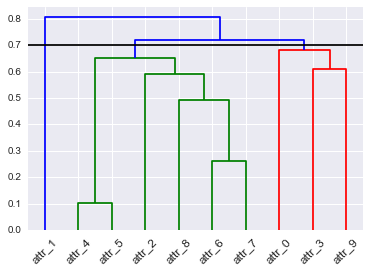
As the other answers said, it is definitely subjective and dependent on what type of granularity you are trying to study. For a general approach, I cut this one to give me 2 clusters and 1 outlier. I would then focus on the two clusters to see if there was anything significant between them.
# Init
import pandas as pd
import numpy as np
import matplotlib.pyplot as plt
import seaborn as sns; sns.set()

# Load data
from sklearn.datasets import load_diabetes

# Clustering
from scipy.cluster.hierarchy import dendrogram, fcluster, leaves_list
from scipy.spatial import distance
from fastcluster import linkage # You can use SciPy one too

%matplotlib inline

# Dataset
A_data = load_diabetes().data
DF_diabetes = pd.DataFrame(A_data, columns = ["attr_%d" % j for j in range(A_data.shape[1])])

# Absolute value of correlation matrix, then subtract from 1 for disimilarity
DF_dism = 1 - np.abs(DF_diabetes.corr())

# Compute average linkage
A_dist = distance.squareform(DF_dism.as_matrix())
Z = linkage(A_dist,method="average")

# Dendrogram
D = dendrogram(Z=Z, labels=DF_dism.index, color_threshold=0.7, leaf_font_size=12, leaf_rotation=45)


hopack(and others) which can estimate the number of clusters, but that doesn't answer your question. $\endgroup$pvclustpackage forRhas functions that give bootstrapped p-values for dendrogram clusters, allowing you to identify groups: is.titech.ac.jp/~shimo/prog/pvclust $\endgroup$