2
$\begingroup$

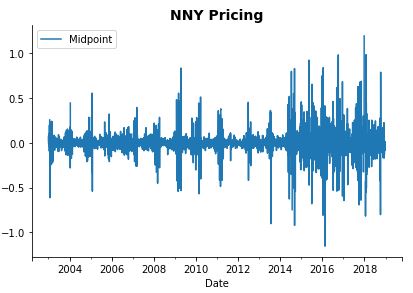
I'm trying to look at natural gas prices from 2003-2018. The issue is after applying log transformation and then diffrencing data by 1, I still seem to get an increase in variance from mid 2014-2018. Do I need to perform another transformation to keep progress stationary? First Applying Log transformation
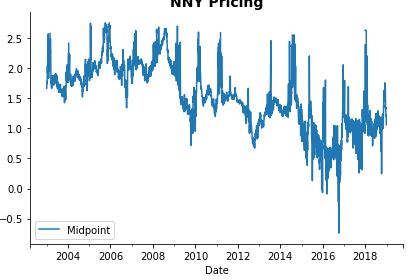
After applying difference operator of 1

energy['Midpoint']=energy['Midpoint'].mask(energy['Midpoint'].sub(energy['Midpoint'].mean()).div(energy['Midpoint'].std()).abs().gt(2))
energy_transformed=energy.copy()
energy_transformed['Midpoint']=np.log(energy_transformed.iloc[:]).diff(1)
$\endgroup$

1 Answer 1

1
$\begingroup$

Five (not mutually exclusive) possibilities come to mind:

  1. The Slutsky http://www-history.mcs.st-andrews.ac.uk/Biographies/Slutsky.html Effect ... Unnecesaary differencing can INJECT variability. Consider the variance of a random process that is differenced OR unnecessarily filtered http://mathworld.wolfram.com/Slutzky-YuleEffect.html

  2. Variance changes can be determinstic i.e. variance changes at particular points in time remediable by GLS ...see http://docplayer.net/12080848-Outliers-level-shifts-and-variance-changes-in-time-series.html

  3. One time Pulses or anomalies that are untreated.

  4. Changes in an intervention effect that has not been accounted for.

  5. Changes in the underlying ARIMA (stochastic) model/paramaters over time .

In general take a look at http://stats.stackexchange.com/questions/18844/when-and-why-to-take-the-log-of-a-distribution-of-numbers

In terms of removing variability I would form an ARMAX model that included possible level shifts , local time trends, pulses and seasonal pulses while identifying the need for a power transform or weighted regression structure . The idea here is to transform when the error variance from a useful model is categorized as heterogenous.

Finally you might want to peruse Variance inhomogeneity in time series when forecasting suggesting that there may be different variability for different months.

$\endgroup$
1
  • 1
    $\begingroup$ Hi: To follow up on what IrishStat said, there's no magic way. It looks like it's still increasing and there's often nothing you can do except look at how you're estimates are effected by it. Given that it's natural gas and finance related, I don't think your second plot looks so terrible. The problem is prediction I assume so see how that goes in the period of high variance versus the period of normal variance. $\endgroup$
    – mlofton
    Commented Dec 29, 2018 at 22:40

Your Answer

By clicking “Post Your Answer”, you agree to our terms of service and acknowledge you have read our privacy policy.

Not the answer you're looking for? Browse other questions tagged or ask your own question.