4
$\begingroup$

I have values of relative humidity on a scale of 0 to 1 (e.g., 0.9 = 90% RH). I also have two cities (A or B). My model is as follows:

mod <- glm(rh ~ city, family = quasibinomial)

I plug my model into emmeans:

emmeans(mod, pairwise~city)

I get this from the emmeans output:

> emmeans(mod, pairwise~city)
$emmeans
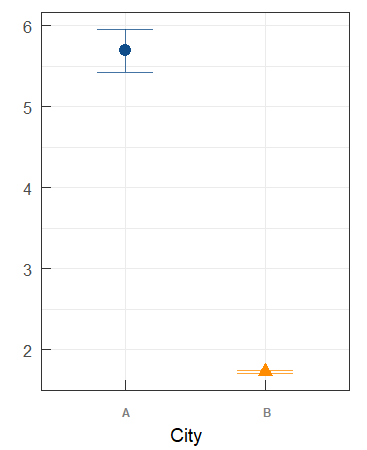
city    emmean         SE  df asymp.LCL asymp.UCL
A     1.727851 0.01619215 Inf  1.696115  1.759587
B     5.688672 0.26446690 Inf  5.170326  6.207018

Results are given on the logit (not the response) scale. 
Confidence level used: 0.95 

$contrasts
contrast   estimate        SE  df z.ratio p.value
A - B      -3.960821 0.2649621 Inf -14.949  <.0001

I then predict back on the data-scale to get the mean city RH difference, and present these as means and 95% CIs.

see here

My questions are these:

1) How can I possibly have values above 1? Relative humidity can't be higher than 100%, so how do I have means of 5.7 and 1.7?

2) If these values are not RH, what are the units of measure? For example, I want to report the mean and 95% confidence intervals, how would I do so? It feels wrong to just say, "the difference in relative humidity between city A and B is 3.96"

$\endgroup$

2 Answers 2

6
$\begingroup$

As your output says

Results are given on the logit (not the response) scale.

So to get them on response scale, you need to pass them through inverse of the logit link function.

You can recall, that generalized linear models are defined in terms of linear predictor, that is passed through link function, to predict mean of some distribution. In case of logistic regression, we use logit link function, i.e.

$$ \operatorname{logit}(p) = \log(\tfrac{p}{1-p}) = \eta = X\beta $$

So the untransformed values returned by logistic regression are log odds. To transform them to probabilities, the linear predictor $\eta = X\beta$ is passed through inverse of the logit function, i.e. logistic function

$$ E(Y|X) = p = \operatorname{logit}^{-1}(\eta) = \frac{\exp(\eta)}{\exp(\eta)+1} $$

TL;DR so to transform the values returned by the function you mention (I am not familiar with this package), you need to use the logistic function, to get the probabilities.

$\endgroup$
2
  • $\begingroup$ Thanks for your response Tim. So the logit scale is a probability? After doing some reading, I'm still confused as to what my numbers actually represent. And I'm still confused as to how I would pass them through the inverse of the logit link function. Is this like back-transforming data? I'm sorry for being obtuse. $\endgroup$ Commented Jun 13, 2019 at 18:42
  • $\begingroup$ @NoraaZamliy no, the opposite. I'll edit my answer for more details. $\endgroup$
    – Tim
    Commented Jun 13, 2019 at 18:56
6
$\begingroup$

Do

emm <- emmeans(mod, "city", type = "response")
emm
pairs(emm)

The comparisons will be odds ratios.

You can also do plot(emm) to see the CIs on the response scale.

It’s all documented. See vignette("basics"), vignette("transformations"), and ?summary.emmGrid

$\endgroup$
2
  • $\begingroup$ So if my emmeans odds ratio output is 0.106 for the city A/city B contrast, does that mean there is a 10.6% difference in humidity between city A and B? I'm so confused. Please help. $\endgroup$ Commented Aug 19, 2019 at 19:03
  • $\begingroup$ No. The odds of something equals p/(1-p): the probably of occurring divided by the probability of not occurring. So the odds ratio you refer to is [pA/(1-pA)] / [pB/(1-pB)]. Note that odds equal to 1 (“even odds”) is equivalent to p equals 1/2. $\endgroup$
    – Russ Lenth
    Commented Aug 19, 2019 at 19:22

Your Answer

By clicking “Post Your Answer”, you agree to our terms of service and acknowledge you have read our privacy policy.

Not the answer you're looking for? Browse other questions tagged or ask your own question.