3
$\begingroup$

What are some essential differences between a frequentist density forecast/prediction and a Bayesian posterior for an outcome of a random variable?

Of course, there will be differences in how they are obtained (via frequentist vs. Bayesian estimation), but I am interested in differences in addition to that. E.g. from a user's perspective, given a frequentist density forecast/prediction vs. a Bayesian posterior, should I treat them differently in any essential way?

$\endgroup$
9
  • 1
    $\begingroup$ I suppose the key difference is that the Bayesian density propagates uncertainty over model parameters into the predictive density, by averaging the likelihood with the posterior distribution. With frequentist methods, I don't think you can do that. At best you can get a confidence interval for the predicted density. $\endgroup$
    – CloseToC
    Commented Sep 10, 2019 at 10:30
  • $\begingroup$ @CloseToC, so the Bayesian posterior would be flatter/wider and better reflect the underlying uncertainty, at least in the sense of accounting for estimation imprecision of model coefficients, unlike a typical frequentist method? $\endgroup$ Commented Sep 10, 2019 at 10:35
  • $\begingroup$ That's my understanding. If we predict $y$ with $x$ with a parametric model, then a frequentist analysis would give us $\widehat{p_{y|x}} = p_{y|x}(y|x; \hat{\theta)}$ with $\hat{\theta}$ chosen by MLE. We can also get a confidence inteval for the parameter and for the density but I don't think you can seamlessly integrate that into the predictive density itself. But the Bayesian predictive density would be $\widehat{p_{y|x}} = \int p_{y|x, \theta}(y|x, \theta) p_{\theta|x}(\theta|x) d\theta$ $\endgroup$
    – CloseToC
    Commented Sep 10, 2019 at 12:24
  • $\begingroup$ What is a frequentist density forecast/prediction? Something like a sliding scale of confidence intervals for some parameter? $\endgroup$ Commented Sep 10, 2019 at 12:24
  • $\begingroup$ @MartijnWeterings, I am not sure when it comes to a strict definition, but let us take a linear model as an example. From OLS or from MLE, we will obtain estimates of the conditional mean and variance. Combined with a distributional assumption (e.g. normality), we have an estimate of the conditional density. We could use this as a density prediction, or to be more accurate, we could also account for estimation imprecision. So I am not sure whether we derive prediction intervals from density or density from prediction intervals. (Confidence intervals for a parameter are yet another thing.) $\endgroup$ Commented Sep 10, 2019 at 12:44

2 Answers 2

4
$\begingroup$

I can imagine a frequentist density forecast/prediction as something like a distribution of intervals.

For instance providing something like the image below which is an image containing multiple confidence boundary lines (the original is here with only a single 95% confidence interval). And something similar can be done with prediction intervals.
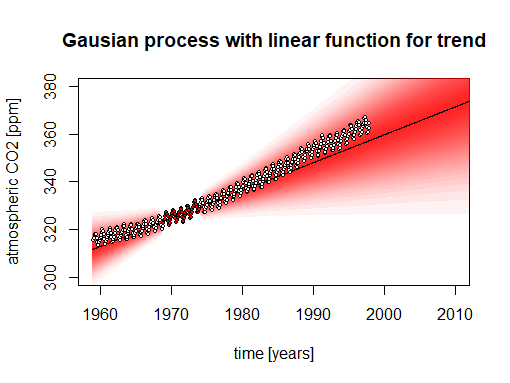
example of a distribution of confidence intervals

With this interpretation the difference between the frequentist density and the Bayesian density corresponds to the difference between a confidence interval and a credible interval. Those two are not the same.

We could say that:

  1. The Bayesian analysis uses more/different information (it includes a posterior distribution for the distribution of parameters, either based on former knowledge or based on assumptions/believes)
  2. The Bayesian analysis expresses a probability in a different way.

    • The confidence interval relates to 'the probability of the observation given the parameters'.
    • The credible interval relates to the 'probability of the parameters given the observation'.

Contrast between confidence interval and prediction interval

The intuition above relies a lot on confidence intervals, but similar things can be said about prediction intervals.

The confidence intervals are maybe more easy to interpret than prediction intervals. Prediction intervals include the error of the mean (which can be seen to coincide with confidence intervals) plus an estimate of the random noise.

It is more difficult to give prediction intervals a same frequentist interpretation, although an alternative way to look at is that for frequentist prediction intervals you can say that 'the frequentist prediction interval will contain the future observation a fraction $x \%$ of the time'.

So the difference between frequentist prediction intervals and Bayesian prediction intervals is still that the Bayesian intervals use more information, but the frequentist prediction interval are independent of from the parameter distribution and 'work' independent from the prior distribution (given that the model is correct).

I imagine that the following interpretation still works 'the frequentist prediction interval relates to the probability of the observation given the predicted value, it is the collection of those predicted values for which the prior observed effects/data/statistics occurs within a region with $x \%$ probability'.

Example prediction of a value for a Gaussian distribution population

When creating a confidence interval for the estimate of the mean of Gaussian distributed population then one can use a t-distribution and this has a geometrical interpretation. The same geometrical interpretation will work for the estimate of a prediction interval.

Let $X_i \sim N(\mu, \sigma)$ and say we observe a sample $X_1, ... , X_n$ of size $n$ and wish to predict $X_{n+1}$.

We can construct a frequentist prediction interval with the interpretation that

  • No matter what the value of $\mu$ and $\sigma$ is, the value $X_{n+1}$ will be $x\%$ of the time inside the prediction interval.

but also:

  • Given a hypothetical predicted value $\tilde{X}_{n+1}$ in the prediction range, the observations $\bar{X}$ and $s$ (the sample mean and sample deviation) will be occuring within some range that occurs $x$ percent of the time. (That means we will only include those values in the prediction range for which we make our observations $x\%$ of the time, such that we will never fail more than $x\%$ of the time)

So instead of considering the distribution of $X_{n+1}$ given the data $\bar{X}$ and $s$, we consider the other way around, we consider the distribution of the data $\bar{X}$ and $s$ given $X_{n+1}$.

(we can plot this distribution because $\bar{X}-X_{n+1}$ is Gaussian distributed, and $s$ has a scaled chi-distribution)
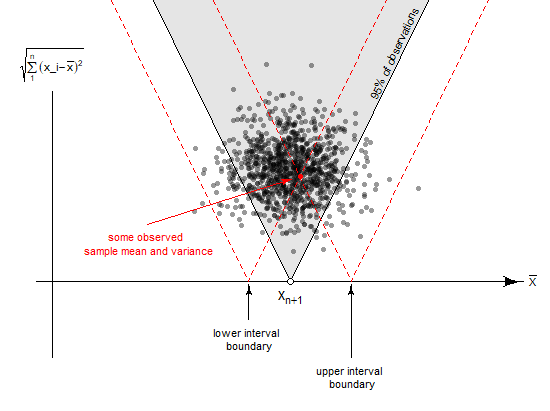
geometric example

  • In the image above you see the distribution of the sample standard deviation and the sample mean given a value for $X_{n+1}$.

    The distribution of this deviation can be bounded by a cone (in the image 95%) and this is independent of $\sigma$ (because both variables, normal distributed and scaled chi distributed) scale the same when $\sigma$ changes thus the distribution of the angle does not change.

  • And the red dotted lines show how you can construct the prediction interval. For a given observation (the red dot), when you have a variable within this range the observation will be inside the 'cone of 95%' for those predicted values.

Thus this prediction interval has an interpretation like a confidence interval: It relates to the probability of the data, given the predicted value (instead of the inverse 'the probability of the predicted value, given the data').

Code for the image:

# settings
set.seed(1)
n <- 10^3
smp = 10

# hypothetical x[n+1]
xn1 <- 7.5

# simulate data and compute statistics
X <- matrix(rnorm(smp*n),n)
prd <- rnorm(n)          
diff <- rowMeans(X)-prd
rss <- sqrt(rowSums((X-rowMeans(X))^2))

#plotting
dev.off()
par(mar=c(0,0,0,0))

plot(xn1+diff, rss, bty = 'n', ylim = c(-3,7), xlim = c(-1,15), xaxt = "n", yaxt = "n", xlab="", ylab = "",
     pch=21,col=rgb(0,0,0,0),bg=rgb(0,0,0,0.4),cex=0.7)

Arrows(-0.5,0,14.5,0,arr.length=0.4)
lines(c(0,0),c(-2,5))

text(0,5,expression(sqrt(sum((x_i-bar(x))^2,i=1,n))),pos=3,cex=0.7)
text(14.7,0,expression(bar(X)),pos=4,cex=0.7)


qt(0.95,smp-1)

ang <- sqrt((smp-1)*(1+1/smp))/qt(0.95,smp-1)

lines(c(xn1-10,xn1,xn1+10),c(10,0,10)*ang)
polygon(c(xn1-10,xn1,xn1+10),c(10,0,10)*ang, 
        col = rgb(0,0,0,0.1), border = NA, lwd=0.01)

text(10.7,6,"95% of observations",srt=65,cex=0.7)

points(xn1, 0, pch=21, col=1, bg = "white")     
text(xn1,0,expression(x[n+1]),pos=1)

points(xn1+diff[1],rss[1],pch=21,col=2,bg=2,cex=0.7)


lines(diff[1]+rss[1]/ang+c(xn1-10,xn1,xn1+10),c(10,0,10)*sqrt((smp-1)*(1+1/smp))/qt(0.95,smp-1),col=2,lty=2)
lines(diff[1]-rss[1]/ang+c(xn1-10,xn1,xn1+10),c(10,0,10)*sqrt((smp-1)*(1+1/smp))/qt(0.95,smp-1),col=2,lty=2)


Arrows(xn1+diff[1]+rss[1]/ang,-2,xn1+diff[1]+rss[1]/ang,-0.2,col=1,cex=0.5,arr.length=0.2)
Arrows(xn1+diff[1]-rss[1]/ang,-1,xn1+diff[1]-rss[1]/ang,-0.2,col=1,cex=0.5,arr.length=0.2)

text(xn1+diff[1]-rss[1]/ang,-1.0,"lower interval \n boundary",pos=1,srt=0,cex=0.7)
text(xn1+diff[1]+rss[1]/ang,-2.0,"upper interval \n boundary",pos=1,srt=0,cex=0.7)


Arrows(3,1.5,xn1+diff[1]-0.4,rss[1]-0.1,col=2,cex=0.5,arr.length=0.2)
text(3,1.5,"some observed \n sample mean and variance",col=2,pos=1,srt=0,cex=0.7)
$\endgroup$
5
  • $\begingroup$ Quick question on intuition: you talk mostly of confidence rather than prediction intervals. Is that not problematic when we are interested in a new realisation from a data generating process rather than in a parameter thereof? $\endgroup$ Commented Sep 10, 2019 at 13:33
  • $\begingroup$ OK. This is helpful. +1 for now. (A couple of hours later) Wow, this is becoming pretty cool! $\endgroup$ Commented Sep 10, 2019 at 17:10
  • $\begingroup$ My understanding of frequentist density prediction is more along the lines of the example @RichardHardy mentioned in the comments (the output of probabilistic regression models). At first glance, it feels like this has a different meaning than your distribution over prediction intervals. But, I'm not sure I completely understand the way you're constructing these distributions. Is there any relationship between the two? $\endgroup$
    – user20160
    Commented Sep 11, 2019 at 20:12
  • $\begingroup$ @user20160 the way that I construct the density is by using the boundaries of many intervals. It is sort of the inverse how you create credible intervals from a posterior density. $\endgroup$ Commented Sep 11, 2019 at 20:32
  • $\begingroup$ I believe it is similar to Richard's comment which seems to be using the sample distribution (which works when the variance of the error is known, otherwise it gets a bit more complicated like you have to use the t-distribution in my example while the sample distribution of the point to be predicted is gaussian) $\endgroup$ Commented Sep 11, 2019 at 20:37
2
$\begingroup$

In practical terms, there are seven issues that should be thought about with regard to the difference between a Bayesian predictive interval and a Frequentist interval.

The issues are:

  1. Sample size
  2. Construction
  3. Boundary conditions
  4. Coherence
  5. Information
  6. Broken intervals
  7. Interpretation

Each of the above items can either cause a difference in calculation, useability or interpretation. Of course, the last item is interpretation above.

  1. Generally, for small sample sizes and outside the exponential family of distributions, there is no reason that Bayesian intervals resemble Frequentist intervals. For some distributions, such as the normal distribution with a diffuse prior, there will be no difference at all in either of the predictive intervals in any practical sense. For others, such as the Cauchy distribution, you can get pretty wild differences in predictive intervals.

  2. Construction

    2a. Construction of the intervals is on different conceptual grounds. The Bayesian predictive interval depends on the predictive density function and a rule. The most common rule in use is to use the highest density region. This rule corresponds to minimizing the K-L divergence between the model and the future values in nature. Other rules could also be used as the only requirement is that the prediction adds up to $\alpha{\%}$. These alternative rules could be understood as minimizing some alternative cost function.

    2b. The Frequentist predictive interval depends on a loss function, although the loss function is often implicit. As with the Bayesian construction, there exists an infinite number of potential prediction intervals because there are an infinite number of potential loss functions. Frequentist intervals depend upon the sampling distribution of some estimator. If you change from the sample mean to the sample median you have changed both loss function and sampling distributions. The predictions will differ. The parameter estimator vanishes as it does in the Bayesian method.

  3. Boundary conditions and discreteness do not impact a Bayesian prediction other than it will account for them. They do impact them in Frequentist methods. It can happen that a Frequentist interval will include impossible values. The method also breaks down when using discrete probabilities. See...

    Lawless, J. and Fredette, M. (2005). Frequentist prediction intervals and predictive distributions. Biometrika, 92(3):529-542.

  4. If you need to use the prediction for gambling purposes, such as setting inventory, allocating funds, or playing a lottery then Bayesian intervals are coherent and Frequentist ones are not. All Frequentist intervals with identical values for their estimators will generate identical intervals though with different samples. Bayesian prediction intervals, in the general case, will generate different predictive intervals with different samples despite having the same estimator as long as the posterior differs.

  5. Bayesian predictions are always admissible predictions given a prior and a loss function. The Bayesian likelihood function is always minimally sufficient. It is not always the case that a Frequentist method uses as much information and so Frequentist estimators can be noisier given identical information. For well-behaved models, such as the normal distribution, this is not generally a problem. Additionally, the Bayesian prediction should include the information in a prior. If the prior is sufficiently informative, then the Bayesian interval will first-order stochastically dominate the Frequentist interval in terms of loss created by using the prediction in a decision.

  6. Although this is usually an issue that coincides with small sample sizes or omitted variables, there is no requirement that the Bayesian $\alpha\%$ interval is a single closed interval with a unimodal likelihood. A Bayesian predictive interval may be $[-5,-1]\cup{[}1,2]$ while the Frequentist interval on the same sample could be $[-2,1]$. With a bimodal underlying density, there could be broken intervals for either.

  7. Interpretation

    7a. The biggest issue is interpretation. Assuming valid models for both estimation tools, there are interpretative differences between the intervals. Frequentist predictive intervals are confidence procedures. Bayesian intervals might be analogous to credible intervals. A Frequentist 95% interval will contain future observations at least 95% of the time, with a guarantee of minimal coverage. There is a 95% chance that a Bayesian 95% interval will contain the future observations.

    7b. The Frequentist method guarantees a level of coverage and that it is unbiased, so it is not a true probability in that it provides no less than an $\alpha\%$ coverage over future predictions. That is part of what leads to incoherence. If you need a guarantee of long-run coverage, though not necessarily for the next set of observations, you should use a Frequentist method. If you need to assign money and minimize the discrepancy between nature and your model, then you should use a Bayesian method. Do note, however, that Lawless and Fredette's intervals listed above do minimize the average K-L divergence.

For many models that are simple, such as those taught in elementary statistics with an uninformative prior, there is no practical difference except interpretation. For complex models, they can differ substantively. You should always think about models in terms of fitness for purpose. One thing I did leave out, above, which is not a theoretical issue but a practical issue, is computability. Bayesian methods are notorious for their difficulty in generating a computation of any kind, whereas Frequentist methods often generate a solution in milliseconds.

$\endgroup$
7
  • $\begingroup$ Thank you, Dave! Looks like I have quite some reading to do (referring to your piece, of course). I am looking forward to it! $\endgroup$ Commented Sep 11, 2019 at 19:39
  • $\begingroup$ Having read it quickly, I wonder if you could specifically address densities rather than intervals. I also wonder whether a frequentist interval must be a single closed interval, unlike a Bayesian one (point 6). $\endgroup$ Commented Sep 11, 2019 at 19:46
  • $\begingroup$ @RichardHardy I wish I could address densities but it is an issue that is unclear. Frequentist predictive densities are a hair's breadth away from a fiducial probability. That is on the edges of my research. All Frequentist predictive intervals are uniformly distributed as with confidence intervals. You get so close to fiducial statistics that I don't touch it as the field of statistics spent five decades arguing over it. $\endgroup$ Commented Sep 11, 2019 at 19:52
  • $\begingroup$ @RichardHardy as to connectedness, because of how Frequentist averaging happens over the sample space, I cannot see a disconnected case but there may be one that I cannot imagine. $\endgroup$ Commented Sep 11, 2019 at 19:53
  • $\begingroup$ @RichardHardy I guess I have to take that back and may have to think of an edit. For a predictive distribution coming from a bimodal likelihood, I could see a split prediction. $\endgroup$ Commented Sep 11, 2019 at 19:54

Your Answer

By clicking “Post Your Answer”, you agree to our terms of service and acknowledge you have read our privacy policy.

Not the answer you're looking for? Browse other questions tagged or ask your own question.