8
$\begingroup$

I am asked in G*Power to enter the Correlation among repeated measures. I have repeated an experiment with the same subjects under 3 conditions (Set1, Set2 and Set3).

I calculate the correlation this way:

lala=cbind(  
  Set1.Weber,
  Set2.Weber,
  Set3.Weber
)
cor(lala)

And get

           Set1.Weber Set2.Weber Set3.Weber
Set1.Weber  1.0000000  0.3683676  0.1283023
Set2.Weber  0.3683676  1.0000000 -0.0959547
Set3.Weber  0.1283023 -0.0959547  1.0000000

as a result.

Is that correct? In G*Power there is only one parameter for the correlation. Should I use the average correlation. In the example:

(0.37+0.13+0.10)/3

?

Here is a screenshot:
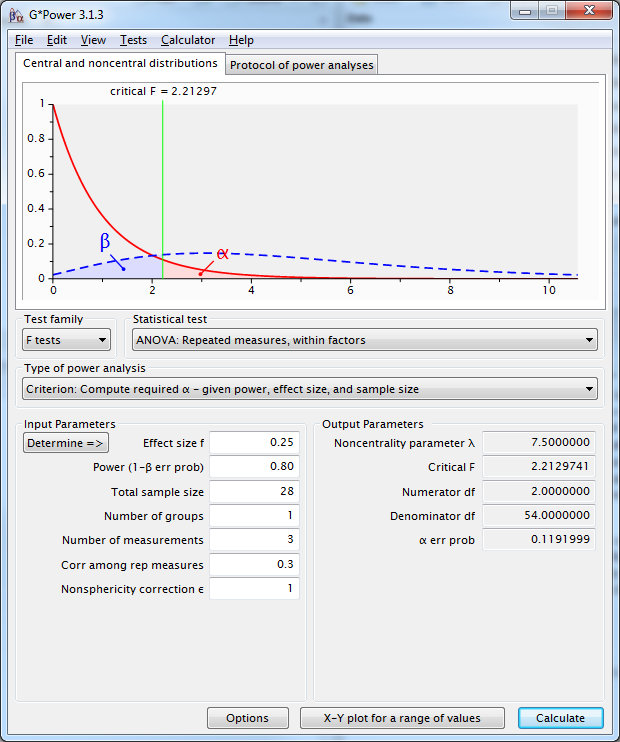
enter image description here

Edit: As a response to the very good answers so far I want to specify the question:


Do I understand that correct that the ANOVA assumes that the correlation should be equal in the matrix and not like in my case (3 different values)? So it maybe not super correct but I can use an average as a poormans solution?! I could use (|a|+|b|+|c|)/3 or sqrt(a²+b³+c²)?!


$\endgroup$
7
  • $\begingroup$ Averaging correlations like you do does not make much sense. In my answer below, I have tried to explain how a correlation matrix can be parametrised so that only a small number of parameters have to be estimated. Anyway, to interpret a correlation matrix, you have to look at the pairwise correlations. $\endgroup$
    – ocram
    Commented Nov 21, 2012 at 19:24
  • $\begingroup$ Ok. I get it. But G*Power is a well known software and I have to use it. I was wondering if someone can give me a hint what to fill in in the correlation parameter. $\endgroup$ Commented Nov 21, 2012 at 20:16
  • $\begingroup$ (|a|+|b|+|c|)/3 --> why do you take absolute values ??? sqrt(a²+b³+c²) --> what is the motivation behind this weird thing? $\endgroup$
    – ocram
    Commented Nov 22, 2012 at 9:22
  • $\begingroup$ @ocram: Haha - I apparantly made some stupid suggestions - sorry. What would you enter in the software as rho in my case? Would (0.37+0.13-0.10)/3 be ok? $\endgroup$ Commented Nov 22, 2012 at 14:00
  • $\begingroup$ The motivation is that I need to enter something ;) $\endgroup$ Commented Nov 22, 2012 at 14:13

4 Answers 4

9
$\begingroup$

Correlation measures association between two random variables and a correlation matrix collects pairwise correlations.

For example, in dimension 3 we have $$ \textrm{Cor} \left( \begin{array}{c} X_1 \\ X_2 \\ X_3 \end{array} \right) = \left( \begin{array}{cccc} \textrm{Cor}(X_1, X_1) & \textrm{Cor}(X_1, X_2) & \textrm{Cor}(X_1, X_3) \\ \textrm{Cor}(X_2, X_1) & \textrm{Cor}(X_2, X_2) & \textrm{Cor}(X_2, X_3) \\ \textrm{Cor}(X_3, X_1) & \textrm{Cor}(X_3, X_2) & \textrm{Cor}(X_3, X_3) \end{array} \right). $$ It is symmetric and there are $1$'s along the diagonal.


When measurements are taken several times on the same individual, we usually expect some positive association that can be quantified by correlation. In the mixed model methodology, in particular, it is typical to put some structure on a correlation matrix.

One possible structure would be $$ \textrm{Cor} \left( \begin{array}{c} X_1 \\ X_2 \\ X_3 \end{array} \right) = \left( \begin{array}{cccc} 1 & \rho & \rho \\ & 1 & \rho \\ & & 1 \end{array} \right), $$ with $0 \leq \rho \leq 1$, that is, correlation is the same regardless of the lag between pairs of repeated measures. That's the compound symmetry (CS) structure.

Another popular example when repeated measures are taken at equally-spaced time points is the AR(1) structure: $$ \textrm{Cor} \left( \begin{array}{c} X_1 \\ X_2 \\ X_3 \end{array} \right) = \left( \begin{array}{cccc} 1 & \rho & \rho^2 \\ & 1 & \rho \\ & & 1 \end{array} \right), $$ that is, correlation decreases with distance in time.

In these two example, only one parameter has to be estimated to get the three entries of the matrix. This generalises to higher dimension.


More details, for example, in the doc for proc mixed, p3955.

$\endgroup$
3
  • 4
    $\begingroup$ +1 nice explanation, but doesn't tell OP how to find the one correlation value to enter into G*Power. $\endgroup$ Commented Nov 21, 2012 at 19:22
  • $\begingroup$ @JackTanner: Thanks! I have to admit I have no idea about G*Power... It is not even clear to me what does "the one correlation value" refer to... I thought it might be the $rho$ parameter... $\endgroup$
    – ocram
    Commented Nov 21, 2012 at 19:26
  • $\begingroup$ @ocram: Thanks. I see what you mean. But still - I need to enter one value. I added a screenshot to make it clear. $\endgroup$ Commented Nov 21, 2012 at 19:32
5
$\begingroup$

The help guide for G*Power 2 defines rho as "the population correlation between the individual levels of the repeated measures factor." Though there is no help currently available in G*Power 3 for the Repeated Measures ANOVA you are interested in, the options available under the "options button" suggests that the "Corr among rep measures" option is refering to rho.

$\endgroup$
2
  • $\begingroup$ Nice you gave the link to the help guide for G*Power (+1)! $\endgroup$
    – ocram
    Commented Nov 22, 2012 at 4:33
  • 1
    $\begingroup$ The link is broken now. $\endgroup$ Commented Jul 13, 2021 at 9:23
5
$\begingroup$

I think @ocram is on the right track here. His first "possible structure" is also called compound symmetry (see here: What is compound symmetry in plain English? for more information). This is the correlational structure that goes with what's called a repeated measures ANOVA, that is, a mixed effects model with a random intercept only (no random effects / slopes for any other variable). However, it appears that the correlations between the sets differ from each other, so this covariance structure is not appropriate. It is possible to determine power for situations like this, but it isn't straightforward. It appears that GPower doesn't have routines specified that can handle your situation. The only way I know of to deal with these more complicated situations is to simulate. However, the answer you get from GPower may be good enough for your purposes.

$\endgroup$
3
  • $\begingroup$ thx for having related my answer to what is acutally asked with respect to G*Power (+1) $\endgroup$
    – ocram
    Commented Nov 22, 2012 at 4:21
  • $\begingroup$ Hello and thanks. Do I understand that correct that the ANOVA assumes that the correlation should be equal in the matrix and not like in my case (3 different values)? So it maybe not super correct but I can use an average as a poormans solution?! I could use (|a|+|b|+|c|)/3 or sqrt(a²+b³+c²)?! $\endgroup$ Commented Nov 22, 2012 at 8:31
  • 2
    $\begingroup$ @manuel.kuehner, a repeated measures ANOVA is a mixed effects regression model w/ all categorical covariates & a random intercept for each subject, but no other random effects. This necessitates a compound symmetry covariance structure (all r's =). Since your data appear to be inconsistent w/ that, rmANOVA probably isn't appropriate for your data. You would ultimately want to fit a mixed effects model w/ an unstructured covariance pattern. However, simply for the sake of determining a reasonable N, you can just plug in each of the r's & see how the N's change; that's likely to be sufficient. $\endgroup$ Commented Nov 22, 2012 at 15:07
3
$\begingroup$

As @ocram and @gung rightly point out, if your correlations vary greatly, a different statistical procedure may be more appropriate. That said, for your case I would suggest two possible ways to estimate a required sample size or achieved power using G*Power:

  1. Use the most conservative estimate. A null correlation among repeated measures will yield a sample size that is equivalent to that of a between subject design divided by the number of groups: A between subjects comparison of your three groups ($f = .25$, $α = .05$, $1-β = .95$) would require a total sample size of $n = 252$. A within subjects comparison with an assumed correlation among repeated measures of $r = 0$ requires a total sample size of $n = 84$. Since each measurement is repeated in all three groups your effective sample size is $84\times3 = 252$. Thus, you could simply use 0 as an estimate for your correlation. However, that will most likely be an overly conservative estimate. Using the lowest correlation coefficient found in your data, would give you a more adequate but still conservative estimate of the required sample size.
  2. Use the mean correlation. A less conservative estimate of the correlation among repeated measures is the mean correlation found in your data. Note, however, correlation coefficients are not normally distributed. The formulas you suggest are, therefore, not appropriate to determine the mean correlation. You need to perform a Fisher-transformation before averaging and afterwards retransform the mean to yield the correct mean correlation. But, I think, if the correlations you enter into the mean vary greatly, this approach may lead to sample size estimates that are too liberal. Comparing the results to those resulting from the most conservative estimate may be helpful.

Since it appears you are using R to conduct your analysis here is a function that will do the calculations for you:

rep.m.cor <- function(x, measure, formula, type = "min") {
  require("reshape2")

  fisher.z <- function(r) {
    return(0.5 * log((1+r)/(1-r)))
  }

  inv.fisher.z <- function(z) {
    return((exp(2*z) - 1)/(exp(2*z) + 1))
  }

  melt.data <- melt(x, measure.vars = measure, na.rm = FALSE)
  wide.data <- dcast(melt.data, formula = formula, mean, value.var = "value")

  correlations <- cor(wide.data[, -1])
  correlations <- correlations[upper.tri(correlations)]

  if(type == "mean") {
    m.correlations <- inv.fisher.z(mean(fisher.z(correlations)))
  } else if(type == "min") {
    m.correlations <- inv.fisher.z(min(fisher.z(correlations)))
  } else {
    stop("Type must be either 'min' or 'mean'.")
  }

  return(m.correlations)
}

x = A data.frame resulting from aggregation, for example aggregate(measure ~ subject * factor1 * factor2, data, mean).

measure = A string providing the name of the measure.

formula = A formula giving the factor for which the correlation should be calculated, for example subject ~ factor1. It is also possible to determine the correlation for the interaction of two or more factors (subject ~ factor1 + factor2; yes, it needs to be a "+"). Note that GPower can be used to perform power analyses for up to two repeated measures factors as long as one of them has only two levels. To do so, enter the larger number of factor levels into the field "Number of measurements" and multiply the effect size $f$ by $\sqrt{2}$ (2 corresponding to the number of levels of the other factor). If both factor have more than two levels GPower will underestimate the required sample size!

type = A string naming the estimation procedure for the correlation among repeated measures. "min" corresponds to the above option 1, "mean" corresponds to the above option 2.

I hope this helps.

P.S.: If you understand German, there are detailed step-by-step instructions (including screenshots) in this book supplement.

$\endgroup$
1
  • $\begingroup$ Thanks a lot for the effort! $\endgroup$ Commented Nov 10, 2020 at 23:10

Your Answer

By clicking “Post Your Answer”, you agree to our terms of service and acknowledge you have read our privacy policy.

Not the answer you're looking for? Browse other questions tagged or ask your own question.