15
$\begingroup$

In medical context, when presenting results from a binary outcome with a continuous predictor, the OR (odds ratio) can be difficult to interpret.

Example:

A doctor does a study in which he wants to see if high blood pressure (continuous) can potentially increases the risk of heart attacks (binary heart attack no/yes).

He does so by retrospectively looking through patient records and noting whether or not they had a heart attack and what their blood pressure was.

He performs a logistic regression with the continuous blood pressure variable and gets an OR of 1.01.

Now the question is. This OR does not seem very drastic and may be difficult to understand for some clinicians. The doctor therefore does a ROC analysis to see at what value the sensitivity and specificity of blood pressure is highest to predict a heart attack. He notices this is at 150 mmHg (ignore the context, let's assume this is the best value for his purposes).

He regresses again, with heart attacks and the new dichotomized BP above or below 150 mmHg and gets an OR of 5.

This is a lot easier for clinicians to understand. If your blood pressure is above 150 mmHg, your odds of having a heart attack increase 5fold (this is of course not to say your probability increases 5fold).

My question is, would this be a correct way to handle this data? Knowing statistics, there are almost always pitfalls to even the slightest adjustments so I want to hear your input.

I should say I understand the problems of dichotomizing continuous data, e.g. it's pretending that the difference changes from no risk to massive risk from 1 mmHg to the next, but if he was to relay some information to his peers of his findings in a digestible manner, would this be possible?

$\endgroup$
3
  • 3
    $\begingroup$ Thank you James, that actually means a lot to me. I'm a medical student in the last stretches of medical school and I've been trying my hardest to understand statistics in the last year or so as I definitely feel a great divide between statisticians and medical students (and physicians for that matter), so my goal is to try to bridge some of the way of the gap in knowledge to be able to work more efficiently with statisticians during my research. This also means my questions are very hit-or-miss as my knowledge is unfortunately very limited compared to statistics/mathematics students. $\endgroup$
    – Paze
    Commented Jan 14, 2020 at 0:37
  • 1
    $\begingroup$ That said, this community has been absolutely invaluable, and continues to be, to my progress. $\endgroup$
    – Paze
    Commented Jan 14, 2020 at 0:47
  • $\begingroup$ Your classifier is trying to learn a strongly nonlinear transform of a continuous input, so why do you believe logistic regression is a good choice? Other algorithms (e.g. tree-based) can automatically learn the threshold. Or else you could featurize the blood pressure into several bins (but more granularity than dichotomizing). Just don't dichotomize to some estimated threshold. (Btw, the threshold value itself could vary based on other variables e.g. age, gender, ethnicity, weight) $\endgroup$
    – smci
    Commented Jan 16, 2020 at 14:06

4 Answers 4

17
$\begingroup$

Dichotomizing a continuous covariate is ill-advised, as has been noted by other users.

One strategy I employ is to rescale the predictor to something more reasonable. 1 mmHg may not be a very meaningful scale on which to interpret changes in BP. But, if you rescale the predictor so that a difference of 1 unit represents say a difference 10 mmHg then things become a little easier to digest and the odds ratio will be more appreciable and have the following interpretation

For every 10 mmHg increase in blood pressure, the odds of MI increases by a factor of $\exp(\beta)$.

$\endgroup$
1
  • 1
    $\begingroup$ +1 I agree with this so much! (Dichotomization sacrifices power, and creates bias.) I would simply add that one can produce probability or risk contrasts for any two values of a continuous variable one cares to examine from a model of outcome vs continuous predictor without needing to dichotomize it. $\endgroup$
    – Alexis
    Commented Jan 15, 2020 at 3:32
12
$\begingroup$

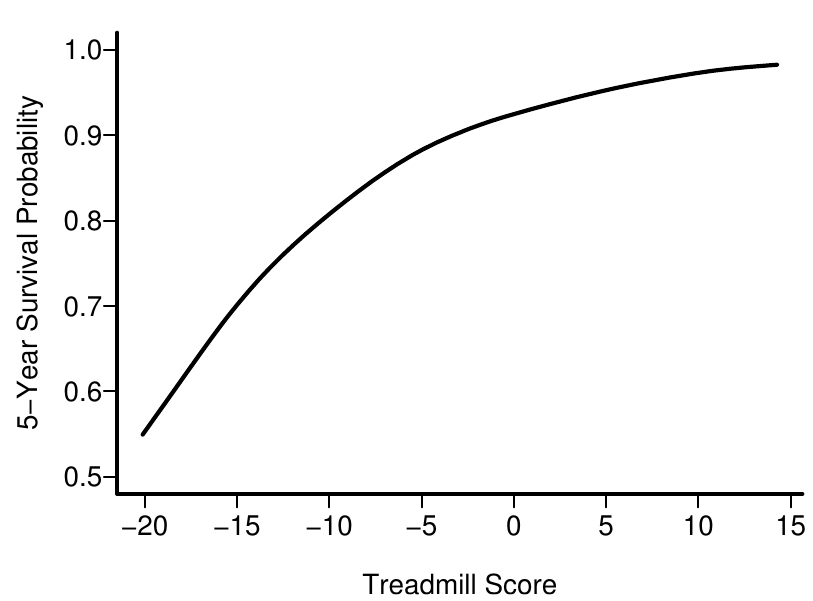
Similar to EdM's answer, a marginal effects plot is a useful way to showcase the relationship between a clinical measurement and outcome while holding other variables constant. These plots are helpful because they show the relationship between the predictor and outcome, so if the outcome is nonlinear, physicians can easily see this and interpret it appropriately. Here is an example from Frank Harrell's book Regression Modeling Strategies

One concern with dichotomizing the blood pressure variable and doing inference is that you've assumed that all patients with blood pressure below 150 mmHg have the same risk due to their blood pressure, which I don't believe is true. I don't think there is any biology behind the assumption that once a patient's blood pressure rises above 150mmHg they magically become at higher risk of a heart attack. It's more likely that small increases in blood pressure lead to small increases in risk.

Incorrect assumptions like this can invalidate the inference because the model is no longer correct. Incorrect models will lead to invalid inferences and incorrect p-values, so it's essential we define the model to best fit what is biologically plausible. This means treating blood pressure as continuous instead of dichotomizing.

$\endgroup$
9
$\begingroup$

For digestibility, use examples from representative situations: in your example, maybe comparing risks at BP of 160 versus BP of 120.

For an approach that can take into account the multiple predictors typically important in clinical studies, use a nomogram. It provides a graphical tool to show how predictor values affect outcomes. The rms package in R provides tools for constructing nomograms from fitted regression models.

This particular approach that you propose:

The doctor therefore does a ROC analysis to see at what value the sensitivity and specificity of blood pressure is highest to predict a heart attack. He notices this is at 150 mmHg... He regresses again, with heart attacks and the new dichotomized BP above or below 150 mmHg and gets an OR of 5

is ill-advised for reasons besides the general issues of dichotomization that you acknowledge. For one, use of sensitivity and specificity tends to involve a hidden assumption that false-positive and false-negative classifications have the same costs. For another, once you use the data to set the cutoff, the assumptions underlying p-value and confidence-interval calculations no longer hold.

$\endgroup$
3
  • 1
    $\begingroup$ Thank you for your answer. I'd like to address parts of it: "For one, use of sensitivity and specificity tends to involve a hidden assumption that false-positive and false-negative classifications have the same costs." I just want to be sure, was this not what I addressed with this: "(ignore the context, let's assume this is the best value for his purposes)." It was made in an edit so I apologize if you answered while I was editing. $\endgroup$
    – Paze
    Commented Jan 13, 2020 at 22:55
  • $\begingroup$ The next thing I want to discuss is: "For another, once you use the data to set the cutoff, the assumptions underlying p-value and confidence-interval calculations no longer hold." I understand this in most examples of data dredging but in this case, the data told us the answer and we wanted to better understand the answer, not come up with new hypothesis. Does this line still hold true? $\endgroup$
    – Paze
    Commented Jan 13, 2020 at 22:55
  • 1
    $\begingroup$ @Paze answers need to be complete for later visitors to the site, not just the original poster, hence the caution about sensitivity etc. For the dichotomization, point estimates of effects can be misleading without confidence intervals. For confidence intervals you need reliable inference so issues of using the data to choose cutoffs still get in the way. With nonlinear relationships between linear predictors and odds or hazard ratios in logistic or Cox regressions there’s also the issue of what type of average the estimates based on the dichotomy represent. $\endgroup$
    – EdM
    Commented Jan 14, 2020 at 12:58
8
$\begingroup$

Another issue is that the relationship between the IV and the DV (here, BP and heart attack risk) might not be linear. I would think this sort of nonlinearity would be quite common in medical fields. Indeed, this is sometimes given as a reason for categorizing the continuous variable (albeit into more than two categories). But this isn't good. A better method is to use a spline of the IV.

$\endgroup$

Your Answer

By clicking “Post Your Answer”, you agree to our terms of service and acknowledge you have read our privacy policy.

Not the answer you're looking for? Browse other questions tagged or ask your own question.