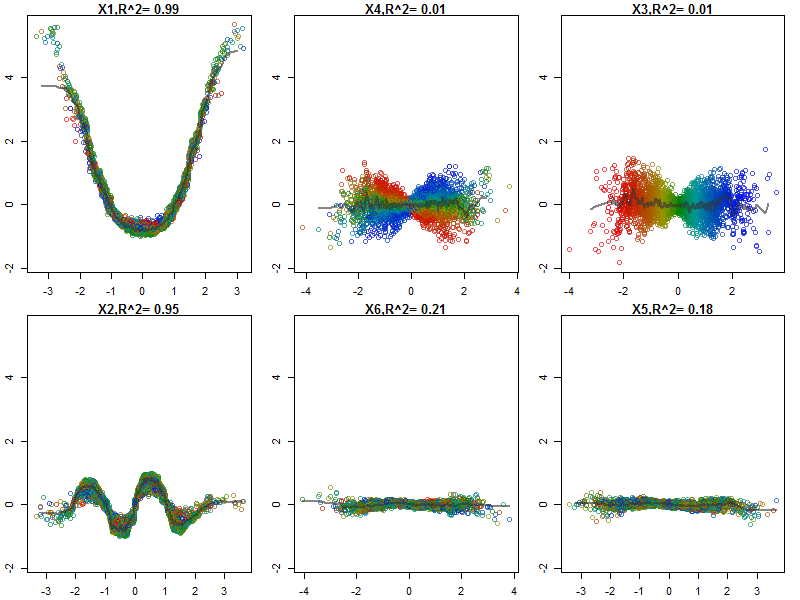
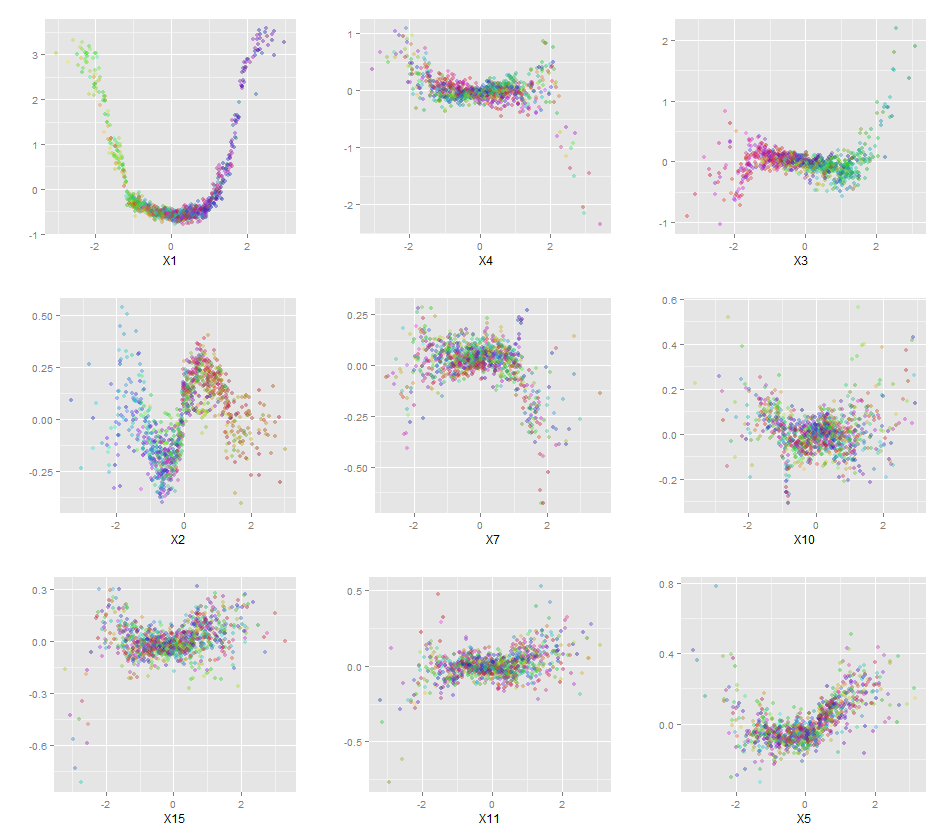
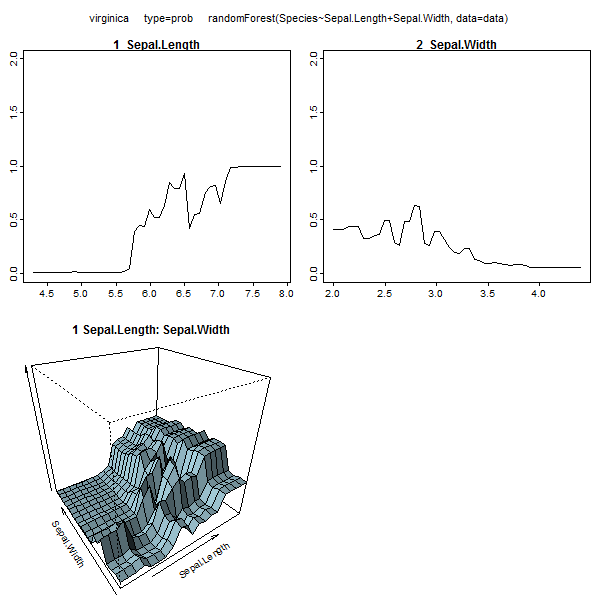
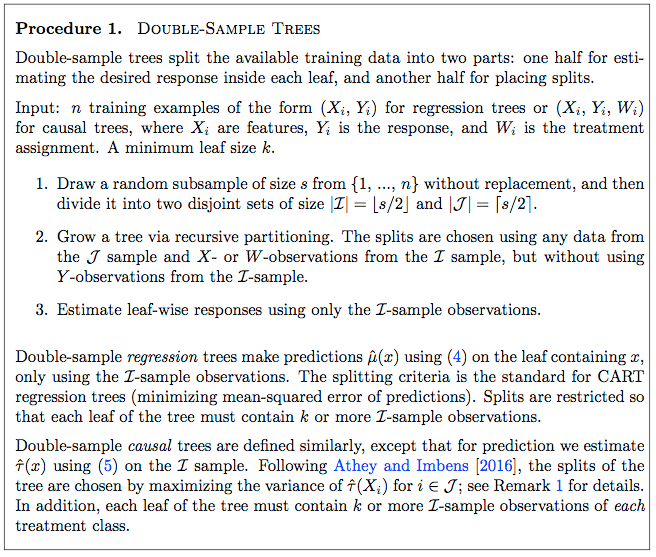
Random Forests are hardly a black box. They are based on decision trees, which are very easy to interpret:
#Setup a binary classification problem
require(randomForest)
data(iris)
set.seed(1)
dat <- iris
dat$Species <- factor(ifelse(dat$Species=='virginica','virginica','other'))
trainrows <- runif(nrow(dat)) > 0.3
train <- dat[trainrows,]
test <- dat[!trainrows,]

#Build a decision tree
require(rpart)
model.rpart <- rpart(Species~., train)
This results in a simple decision tree:
> model.rpart
n= 111

node), split, n, loss, yval, (yprob)
      * denotes terminal node

1) root 111 35 other (0.68468468 0.31531532)
  2) Petal.Length< 4.95 77  3 other (0.96103896 0.03896104) *
  3) Petal.Length>=4.95 34  2 virginica (0.05882353 0.94117647) *
If Petal.Length < 4.95, this tree classifies the observation as "other." If it's greater than 4.95, it classifies the observation as "virginica." A random forest is simple a collection of many such trees, where each one is trained on a random subset of the data. Each tree then "votes" on the final classification of each observation.
model.rf <- randomForest(Species~., train, ntree=25, proximity=TRUE, importance=TRUE, nodesize=5)
> getTree(model.rf, k=1, labelVar=TRUE)
  left daughter right daughter    split var split point status prediction
1             2              3  Petal.Width        1.70      1       <NA>
2             4              5 Petal.Length        4.95      1       <NA>
3             6              7 Petal.Length        4.95      1       <NA>
4             0              0         <NA>        0.00     -1      other
5             0              0         <NA>        0.00     -1  virginica
6             0              0         <NA>        0.00     -1      other
7             0              0         <NA>        0.00     -1  virginica
You can even pull out individual trees from the rf, and look at their structure. The format is slightly different than for rpart models, but you could inspect each tree if you wanted and see how it's modeling the data.
Furthermore, no model is truly a black box, because you can examine predicted responses vs actual responses for each variable in the dataset. This is a good idea regardless of what sort of model you are building:
library(ggplot2)
pSpecies <- predict(model.rf,test,'vote')[,2]
plotData <- lapply(names(test[,1:4]), function(x){
  out <- data.frame(
    var = x,
    type = c(rep('Actual',nrow(test)),rep('Predicted',nrow(test))),
    value = c(test[,x],test[,x]),
    species = c(as.numeric(test$Species)-1,pSpecies)
    )
  out$value <- out$value-min(out$value) #Normalize to [0,1]
  out$value <- out$value/max(out$value)
  out
})
plotData <- do.call(rbind,plotData)
qplot(value, species, data=plotData, facets = type ~ var, geom='smooth', span = 0.5)

I've normalized the variables (sepal and petal length and width) to a 0-1 range. The response is also 0-1, where 0 is other and 1 is virginica. As you can see the random forest is a good model, even on the test set.
Additionally, a random forest will compute various measure of variable importance, which can be very informative:
> importance(model.rf, type=1)
             MeanDecreaseAccuracy
Sepal.Length           0.28567162
Sepal.Width           -0.08584199
Petal.Length           0.64705819
Petal.Width            0.58176828
This table represents how much removing each variable reduces the accuracy of the model. Finally, there are many other plots you can make from a random forest model, to view what's going on in the black box:
plot(model.rf)
plot(margin(model.rf))
MDSplot(model.rf, iris$Species, k=5)
plot(outlier(model.rf), type="h", col=c("red", "green", "blue")[as.numeric(dat$Species)])
You can view the help files for each of these functions to get a better idea of what they display.


