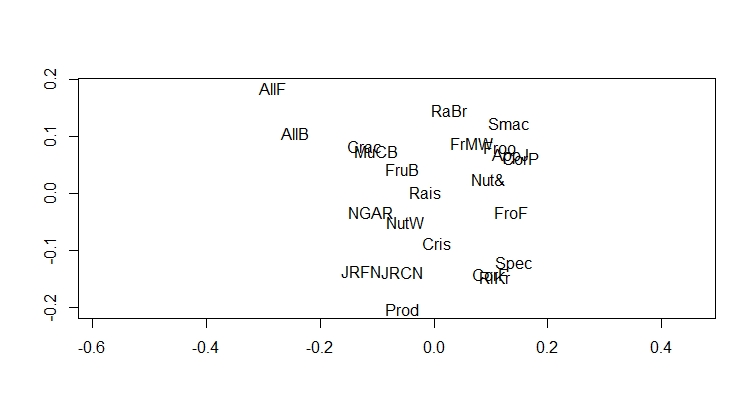
The MDS performed here is non-metric MDS:
Kruskal's stress (or loss function) as defined in your question:
\begin{equation}
\sqrt{\frac{\sum \left(d_{ij}-\delta_{ij}\right)^2}{\sum d_{ij}^{2}}}
\end{equation}
where the disparities $\delta_{ij}$ preserve the order of the original dissimilarities
To minimise Kruskal's stress in R you can use the function isoMDS in the MASS package.
Below I provide a simple example of this with the Kellogg's data from Multidimensional Scaling by Cox & Cox (2001).
library(MASS)
library(cluster)

Kellog.dat$Shelf <- as.factor(Kellog.dat$Shelf)

# Using daisy with Gower's metric like in your question
gower.dissimilarity <- daisy(Kellog.dat, metric= "gower")

# Minimising the stress function
nonmetric.MDS <- isoMDS(gower.dissimilarity,k=2)
In the output from isoMDS you can see that the stress converged
initial  value 19.588355
iter   5 value 14.955953
iter  10 value 14.577013
iter  10 value 14.575003
iter  10 value 14.575003
final  value 14.575003
converged
Then you can also create a plot if you would like to do so
plot(nonmetric.MDS$points,asp=1,type = "n",xlab="",ylab="")
text(nonmetric.MDS$points, labels = rownames(Kellog.dat))

Here is the data that I used if you want to try it out for yourself:
Kellog.dat <-
structure(list(NumCal = c(70L, 50L, 110L, 100L, 110L, 110L, 110L,
110L, 110L, 100L, 120L, 110L, 140L, 160L, 120L, 140L, 90L, 100L,
120L, 90L, 110L, 110L, 110L), Protein = c(4L, 4L, 2L, 2L, 1L,
3L, 2L, 2L, 1L, 3L, 3L, 2L, 3L, 3L, 2L, 3L, 3L, 3L, 3L, 2L, 2L,
2L, 6L), Fat = c(1L, 0L, 0L, 0L, 0L, 3L, 0L, 1L, 0L, 0L, 0L,
1L, 1L, 2L, 1L, 2L, 0L, 0L, 1L, 0L, 0L, 1L, 0L), Sodium = c(260L,
140L, 125L, 290L, 90L, 140L, 220L, 125L, 200L, 0L, 240L, 170L,
170L, 150L, 190L, 220L, 170L, 320L, 210L, 0L, 290L, 70L, 230L
), DietFibre = c(9L, 14L, 1L, 1L, 1L, 4L, 1L, 1L, 1L, 3L, 5L,
1L, 2L, 3L, 0L, 3L, 3L, 1L, 5L, 2L, 0L, 1L, 1L), CarboHyds = c(7L,
8L, 11L, 21L, 13L, 10L, 21L, 11L, 14L, 14L, 14L, 17L, 20L, 17L,
15L, 21L, 18L, 20L, 14L, 15L, 22L, 9L, 16L), Sugars = c(5L, 0L,
14L, 2L, 12L, 7L, 3L, 13L, 11L, 7L, 12L, 6L, 9L, 13L, 9L, 7L,
2L, 3L, 12L, 6L, 3L, 15L, 3L), Shelf = c(3L, 3L, 2L, 1L, 2L,
3L, 3L, 2L, 1L, 2L, 3L, 3L, 3L, 3L, 2L, 3L, 3L, 3L, 2L, 3L, 1L,
2L, 1L), Potassium = c(320L, 330L, 30L, 35L, 20L, 160L, 30L,
30L, 25L, 100L, 190L, 60L, 95L, 160L, 40L, 130L, 90L, 45L, 240L,
110L, 35L, 40L, 55L), VitMins = c(25L, 25L, 25L, 25L, 25L, 25L,
25L, 25L, 25L, 25L, 25L, 100L, 100L, 25L, 25L, 25L, 25L, 100L,
25L, 25L, 25L, 25L, 25L)), .Names = c("NumCal", "Protein", "Fat",
"Sodium", "DietFibre", "CarboHyds", "Sugars", "Shelf", "Potassium",
"VitMins"), class = "data.frame", row.names = c("AllB", "AllF",
"AppJ", "CorF", "CorP", "Crac", "Cris", "Froo", "FroF", "FrMW",
"FruB", "JRCN", "JRFN", "MuCB", "Nut&", "NGAR", "NutW", "Prod",
"RaBr", "Rais", "RiKr", "Smac", "Spec"))

