3
$\begingroup$

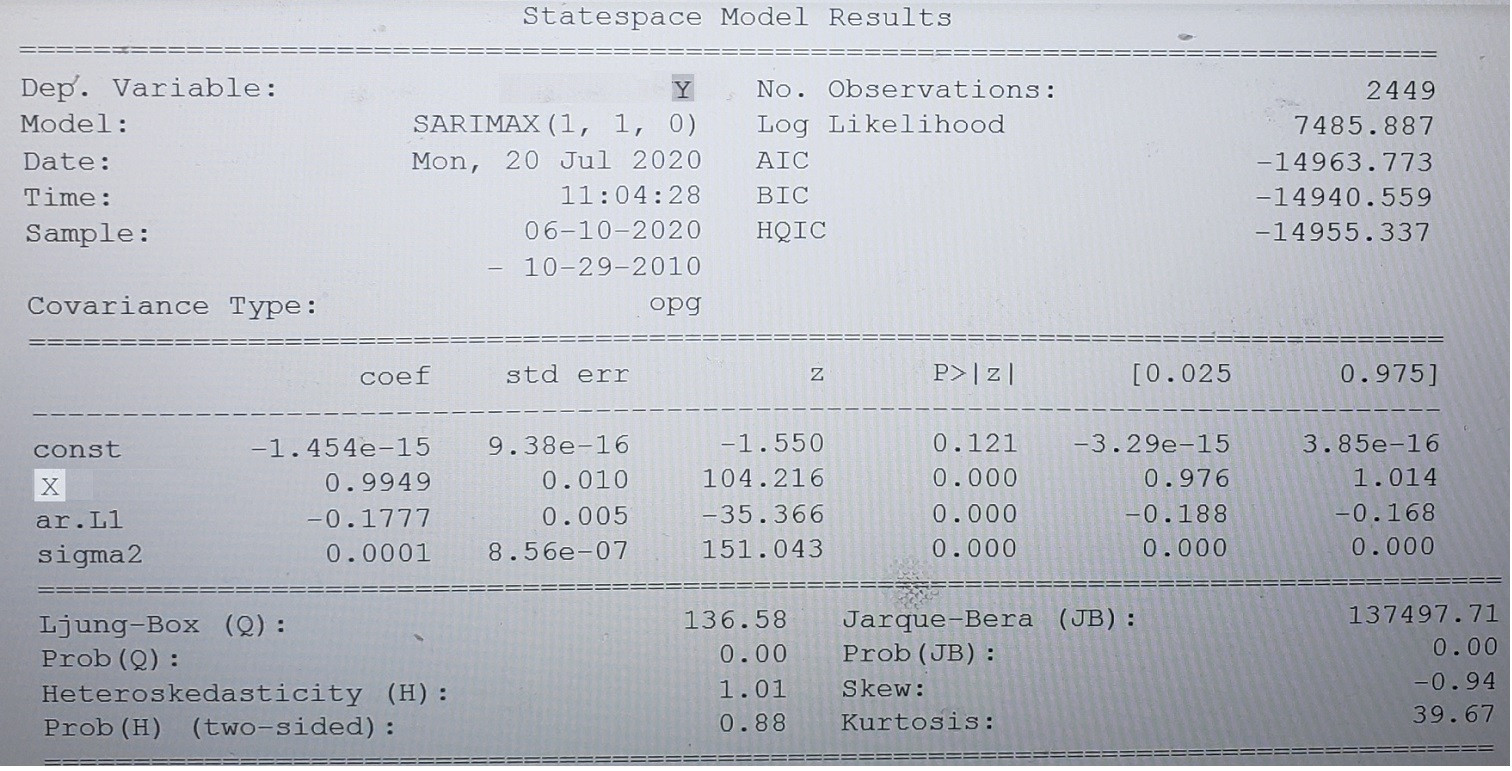
I have fit an ARIMAX (1, 1, 0) model to a timeseries dataset consisting of 1 endogenous timeseries ("Y") and 1 exogenous timeseries ("X"). My exogenous timeseries in the model was defined as sm.add_constant(df["X"]). Stationarity and invertibility were enforced in the Statsmodels SARIMAX model.

The output of the model is as seen in the attached image:

Model summary

For the fourth to the last record in the timeseries:

  • the model's predicted (and fitted) value is 6.58713620525664
  • the Y value is 6.5895
  • the X value is 6.6768

For the third to the last record in the timeseries:

  • the model's predicted (and fitted) value is 6.59034839014186
  • the Y value is 6.609
  • the X value is 6.67855

For the record before the last record in the timeseries:

  • the model's predicted (and fitted) value is 6.61892751060232
  • the Y value is 6.5815
  • the X value is 6.6917

For the last (oldest) record in the timeseries:

  • the model's predicted (and last fitted) value is 6.56786815053348
  • the Y value is 6.5805
  • the X value is 6.67075

For the first prediction:

  • the model's predicted value is 6.59319101863394
  • the X value is 6.68705
  • (There is no Y value)

I have tried to recreate the predicted values manually without any success. Can anyone help, please?

$\endgroup$
7
  • $\begingroup$ What are the second to last historical values ($X$, $\hat{y}$ and $y$)? $\endgroup$ Commented Jul 20, 2020 at 13:48
  • $\begingroup$ @StephanKolassa, I have included the data in the question. Please let me know if you need additional information. Thanks for helping me! $\endgroup$
    – Newwone
    Commented Jul 20, 2020 at 14:10
  • $\begingroup$ @StephanKolassa I have added the 3rd and 4th to the last data. Thanks $\endgroup$
    – Newwone
    Commented Jul 20, 2020 at 14:22
  • $\begingroup$ Explain what you have done, show your calculations. The most likely reasons for discrepancy: 1) residual pre sampling and 2) you are not using regression with ARIMA (like statsmodel does), but ARIMAX see details robjhyndman.com/hyndsight/arimax $\endgroup$
    – Aksakal
    Commented Jul 20, 2020 at 14:24
  • $\begingroup$ also, if this is a homework, tag it with self-study $\endgroup$
    – Aksakal
    Commented Jul 20, 2020 at 14:26

2 Answers 2

1
$\begingroup$

Basically Stephan's answer has it right, except that his code is not computing $\hat \epsilon_{t-1}$ and $\hat \epsilon_{t-2}$ correctly. Conditional on having observed $y_{t-1}$ and $x_{t-1}$, we should have:

$$\hat \epsilon_{t-1} = y_{t-1} - (\beta_0 + \beta_1 x_{t-1}) = 6.5805 - 6.63672917 = -0.05622917$$

Edit: So, to be clear, conditional on knowing $y_{t-1}$ and $x_{t-1}$, we actually know the value of $\epsilon_{t-1}$, not just an estimate, and so we don't need the "hat" over it.

Then, proceeding similarly for $\epsilon_{t-2}$, we have:

$$\epsilon_{t-1} = -0.05622917 \\ \epsilon_{t-2} = -0.07607233$$

And so the prediction for $\epsilon_t$ is:

$$\hat \epsilon_t = (1 + -0.1777) * (-0.05622917) - (-0.1777) * (-0.07607233) = -0.059755299532$$

Finally, we can compute the prediction for $y_t$:

$$\hat y_t = -1.454e^{-15} + 0.9949 * 6.68705 + (-0.059755299532) = 6.593190745467998$$

Which matches the prediction you gave above up to as much precision as we can expect given that you only provided 4-5 decimals for the data and parameters.

$\endgroup$
3
  • $\begingroup$ thank you! Using all the decimals for the data and parameters, I can now match the statsmodels outputs following your guidance. $\endgroup$
    – Newwone
    Commented Jul 20, 2020 at 20:33
  • $\begingroup$ could you please see if you could help with this issue I am having with Statsmodels prediction? It's not producing results in line with my understanding of the model - stats.stackexchange.com/questions/500067/… $\endgroup$
    – Newwone
    Commented Dec 9, 2020 at 17:11
  • $\begingroup$ can you please confirm SARIMAX still works in the way you have described? It seems the predictions no longer include the addition of the et. The predictions appear to be just the linear regression component only. See my question here for an example with data - stats.stackexchange.com/questions/500067/… $\endgroup$
    – Newwone
    Commented Dec 9, 2020 at 21:52
2
$\begingroup$

First off, I can't recreate your numbers either, but I'll write down what I did - it may still be helpful.


Judging from the documentation, SARIMAX fits a regression with SARIMA errors. This is not what is commonly called a SARIMAX model. Rob Hyndman's blog post refers to R, but it should also be relevant here.

That is, the model should be

$$ y_t=\beta_0+\beta_1x_t+\epsilon_t $$

with $\epsilon_t\sim\text{ARIMA}(1,1,0)$, or

$$ (\epsilon_t-\epsilon_{t-1}) = \phi(\epsilon_{t-1}-\epsilon_{t-2})+\eta_t $$ with innovations $\eta_t\sim N(0,\sigma^2)$.

So to predict $\hat{y}_t$, we feed in the estimates $\hat{\beta}_0$ and $\hat{\beta}_1$, and we separately need to predict $\hat{\epsilon}_t$ based on $\hat{\phi}$ and previous errors based on

$$ \epsilon_t = (1+\phi)\epsilon_{t-1}-\phi\epsilon_{t-2}+\eta_t. $$

For $\epsilon_{t-1}$ and $\epsilon_{t-2}$, we can plug in $\hat{\epsilon}_{t-1}=y_{t-1}-\hat{y}_{t-1}$ and $\hat{\epsilon}_{t-2}=y_{t-2}-\hat{y}_{t-2}$. However, that doesn't seem to work (in R):

> phi <- -0.1777
> epsilon <- (1+phi)*(6.5805-6.56786815053348) - phi*(6.5815-6.61892751060232)
> -1.454e-15 + 0.9949*6.68705 + epsilon
[1] 6.656682
$\endgroup$
2

Your Answer

By clicking “Post Your Answer”, you agree to our terms of service and acknowledge you have read our privacy policy.

Not the answer you're looking for? Browse other questions tagged or ask your own question.