4
$\begingroup$

For simplicity, let's restrict multiple linear regression case to 2 predictors, $x_1, x_2$. You regress $y$ on each individually and get $\hat{\beta}_1, \hat{\beta}_2$. Now you regress $y$ on both and get $\hat{\gamma}_1, \hat{\gamma}_2$.

So I know if $(x_1 - \bar{x}_1 \perp \bar{x}_2$, then $\hat{\beta}_i = \hat{\gamma}_i$, but if they're not orthogonal, what can be said about the relationship between them?

If in each of the simple linear regression cases, the slope was positive, i.e., $\hat{\beta}_1, \hat{\beta_2} > 0$, can we expect $\hat{\gamma}_1, \hat{\gamma}_2 > 0$?

I just asked a similar question on the math SE (https://math.stackexchange.com/questions/3791992/relationship-between-projection-of-y-onto-x-1-x-2-individually-vs-projecti), but I'm looking to gain more of a linear algebra intuition from answers to that question. Here, I am hoping for a broader intuition (both statistical and theoretical) of the relationship between simple and multiple linear regression coefficients.

$\endgroup$
1
  • $\begingroup$ See Frisch–Waugh–Lovell theorem and Simpsons paradox. $\endgroup$ Commented Aug 15, 2020 at 17:40

1 Answer 1

3
$\begingroup$

Here is a simple example that provides insight.

y = c(5.8,5.2,4.7,8.7,8.1,7.7,10.2,9.6,9.0)
x1 = c(1,1.5,2,1.8,2.7,3.5,3,4,4.5)
x2 = c(1,1,1,2,2,2,3,3,3)

summary(lm(y~x1))
summary(lm(y~x2))
summary(lm(y~x1+x2))

plot(x1,y,col=x2)
legend("topleft", c("x2=1", "x2=2", "x2=3"), pch=1, col=1:3)

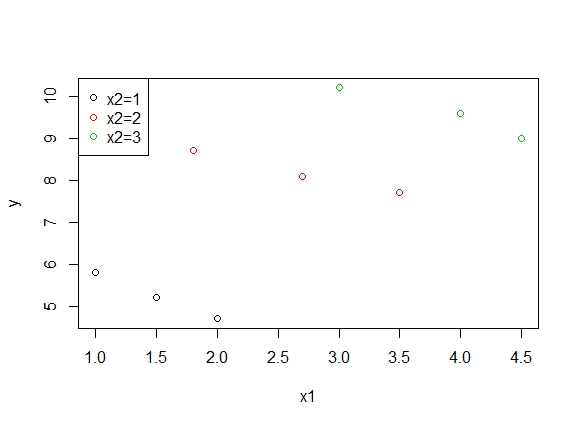
The simple regressions have significant positive relationships, but the multiple regression shows that the effect of x1 is significant and negative. The graph gives the intuition clearly:

Multiple Regression Graph

Ignoring x1, there are generally higher values of y for larger x2. Similarly, ignoring x2, there are generally larger values of y for larger x1. These observations explain the simple regression results.

In the multiple regression model, the slope coefficients are estimates of the effect of one x while the other is held fixed. And you can easily see in the graph that the values of y are smaller as x1 increases within any of the three groups where x2 is held fixed (at either 1,2, or 3).

$\endgroup$
10
  • $\begingroup$ "In the multiple regression model, the slope coefficients are estimates of the effect of one x while the other is held fixed" In the simple linear regression model, isn't the unmodeled $x$ technically fixed too? I don't think I understand what "fixed" entails in this context. $\endgroup$
    – roulette01
    Commented Aug 15, 2020 at 18:42
  • $\begingroup$ @dd2205 “fixed” meaning what? I take “fixed” to mean in the sense that we hold other variables fixed when we take partial derivatives in multivariable calculus. $\endgroup$
    – Dave
    Commented Aug 15, 2020 at 19:02
  • 1
    $\begingroup$ The unmodeled x is definitely not fixed in the simple models. That's why the slope coefficients are both positive in my example. The reason for the "fixed" concept lies in the model itself: $E(y|x_1,x_2) = \beta_0 + \beta_1 x_1 + \beta_2x_2$ implies that, eg, $E(y|x_1,x_2=1) = \beta_0 + \beta_1 x_1 + \beta_2 (1) = (\beta_0 + \beta_2) + \beta_1 x_1$. So $\beta_1$ in the multiple regression model is the effect of $x_1$ when $x_2$ is fixed (at any value, not just 1.) $\endgroup$ Commented Aug 15, 2020 at 19:05
  • $\begingroup$ Yes, you can think of the "held fixed" concept in terms of partial derivatives as well. $\endgroup$ Commented Aug 15, 2020 at 19:07
  • $\begingroup$ This generalizes to any number of predictors right? For example, if we had $p$ predictors, we can interpret $\beta_1$ as the effect of $x_1$ when $x_2, \ldots, x_p$ are fixed? $\endgroup$
    – roulette01
    Commented Aug 15, 2020 at 19:15

Your Answer

By clicking “Post Your Answer”, you agree to our terms of service and acknowledge you have read our privacy policy.

Not the answer you're looking for? Browse other questions tagged or ask your own question.