I've started studying different forecasting algorithms, using R. As an example, maybe not the best one (due to a lack of seasonality), I am using Facebook stocks.
Training set:
SYMBOL <- getSymbols("FB", from = "2015-01-01", to = "2019-12-31")
Stocks_FB_day <- get(SYMBOL[1])
Stocks_FB_day_Cl <- Cl(Stocks_FB_day)
Testing set:
SYMBOL <- getSymbols("FB", from = "2020-01-01", to = "2020-01-21")
Stocks_FB_day <- get(SYMBOL[1])
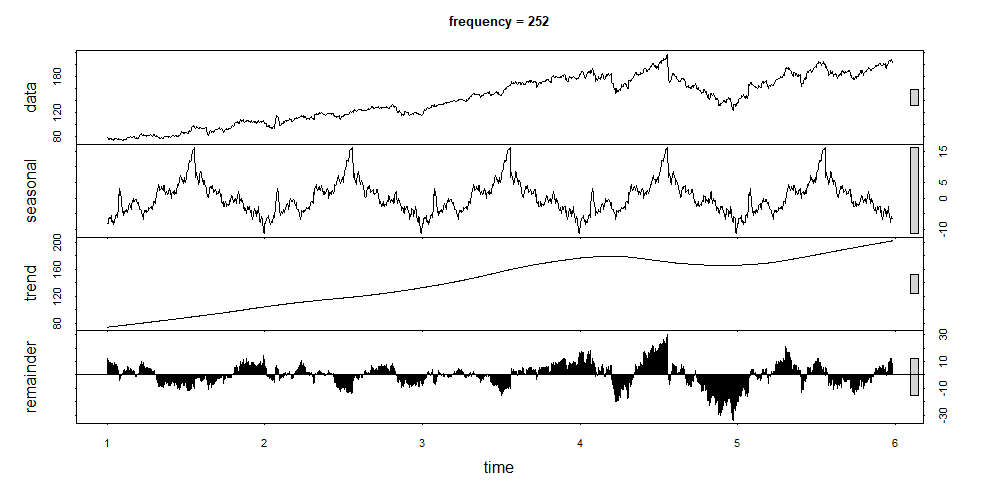
I have built different models, including ARIMA. I know this one is not the most suitable for daily stock data, however, I've decided to give it a try. Taking into account that there are approximately 252 observations per year, I've created decomposition plots, using stl() function and setting frequencies equal to 126 (half a year) and 252 (a full year). Both plots show that seasonal signals are not really essential.
Here is one of them:
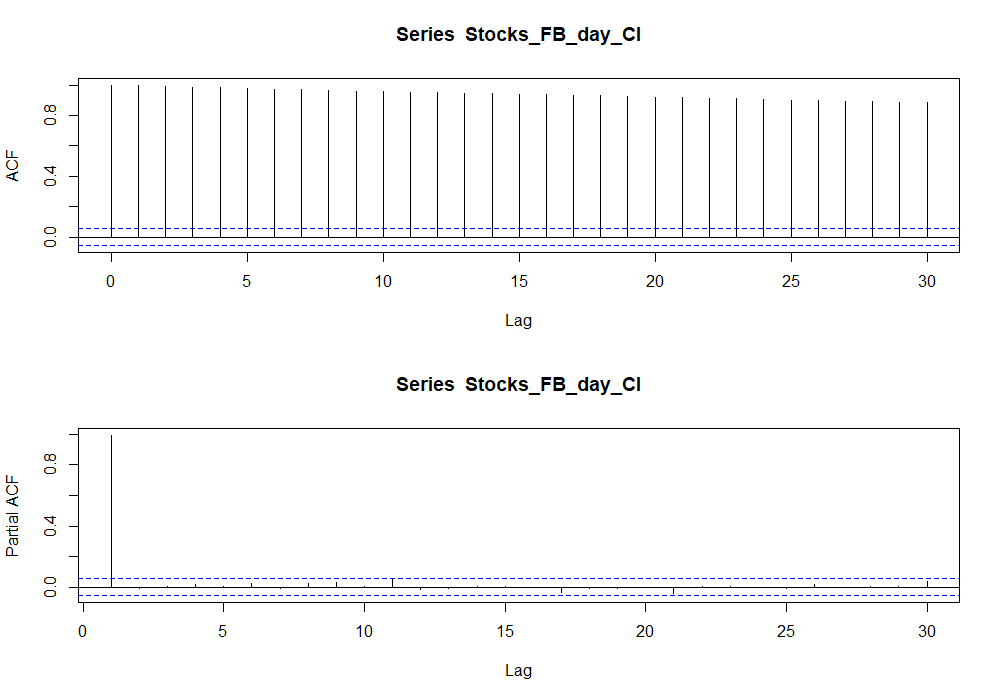
It can also be concluded from the ACF and PACF graphs (maybe I am wrong?):
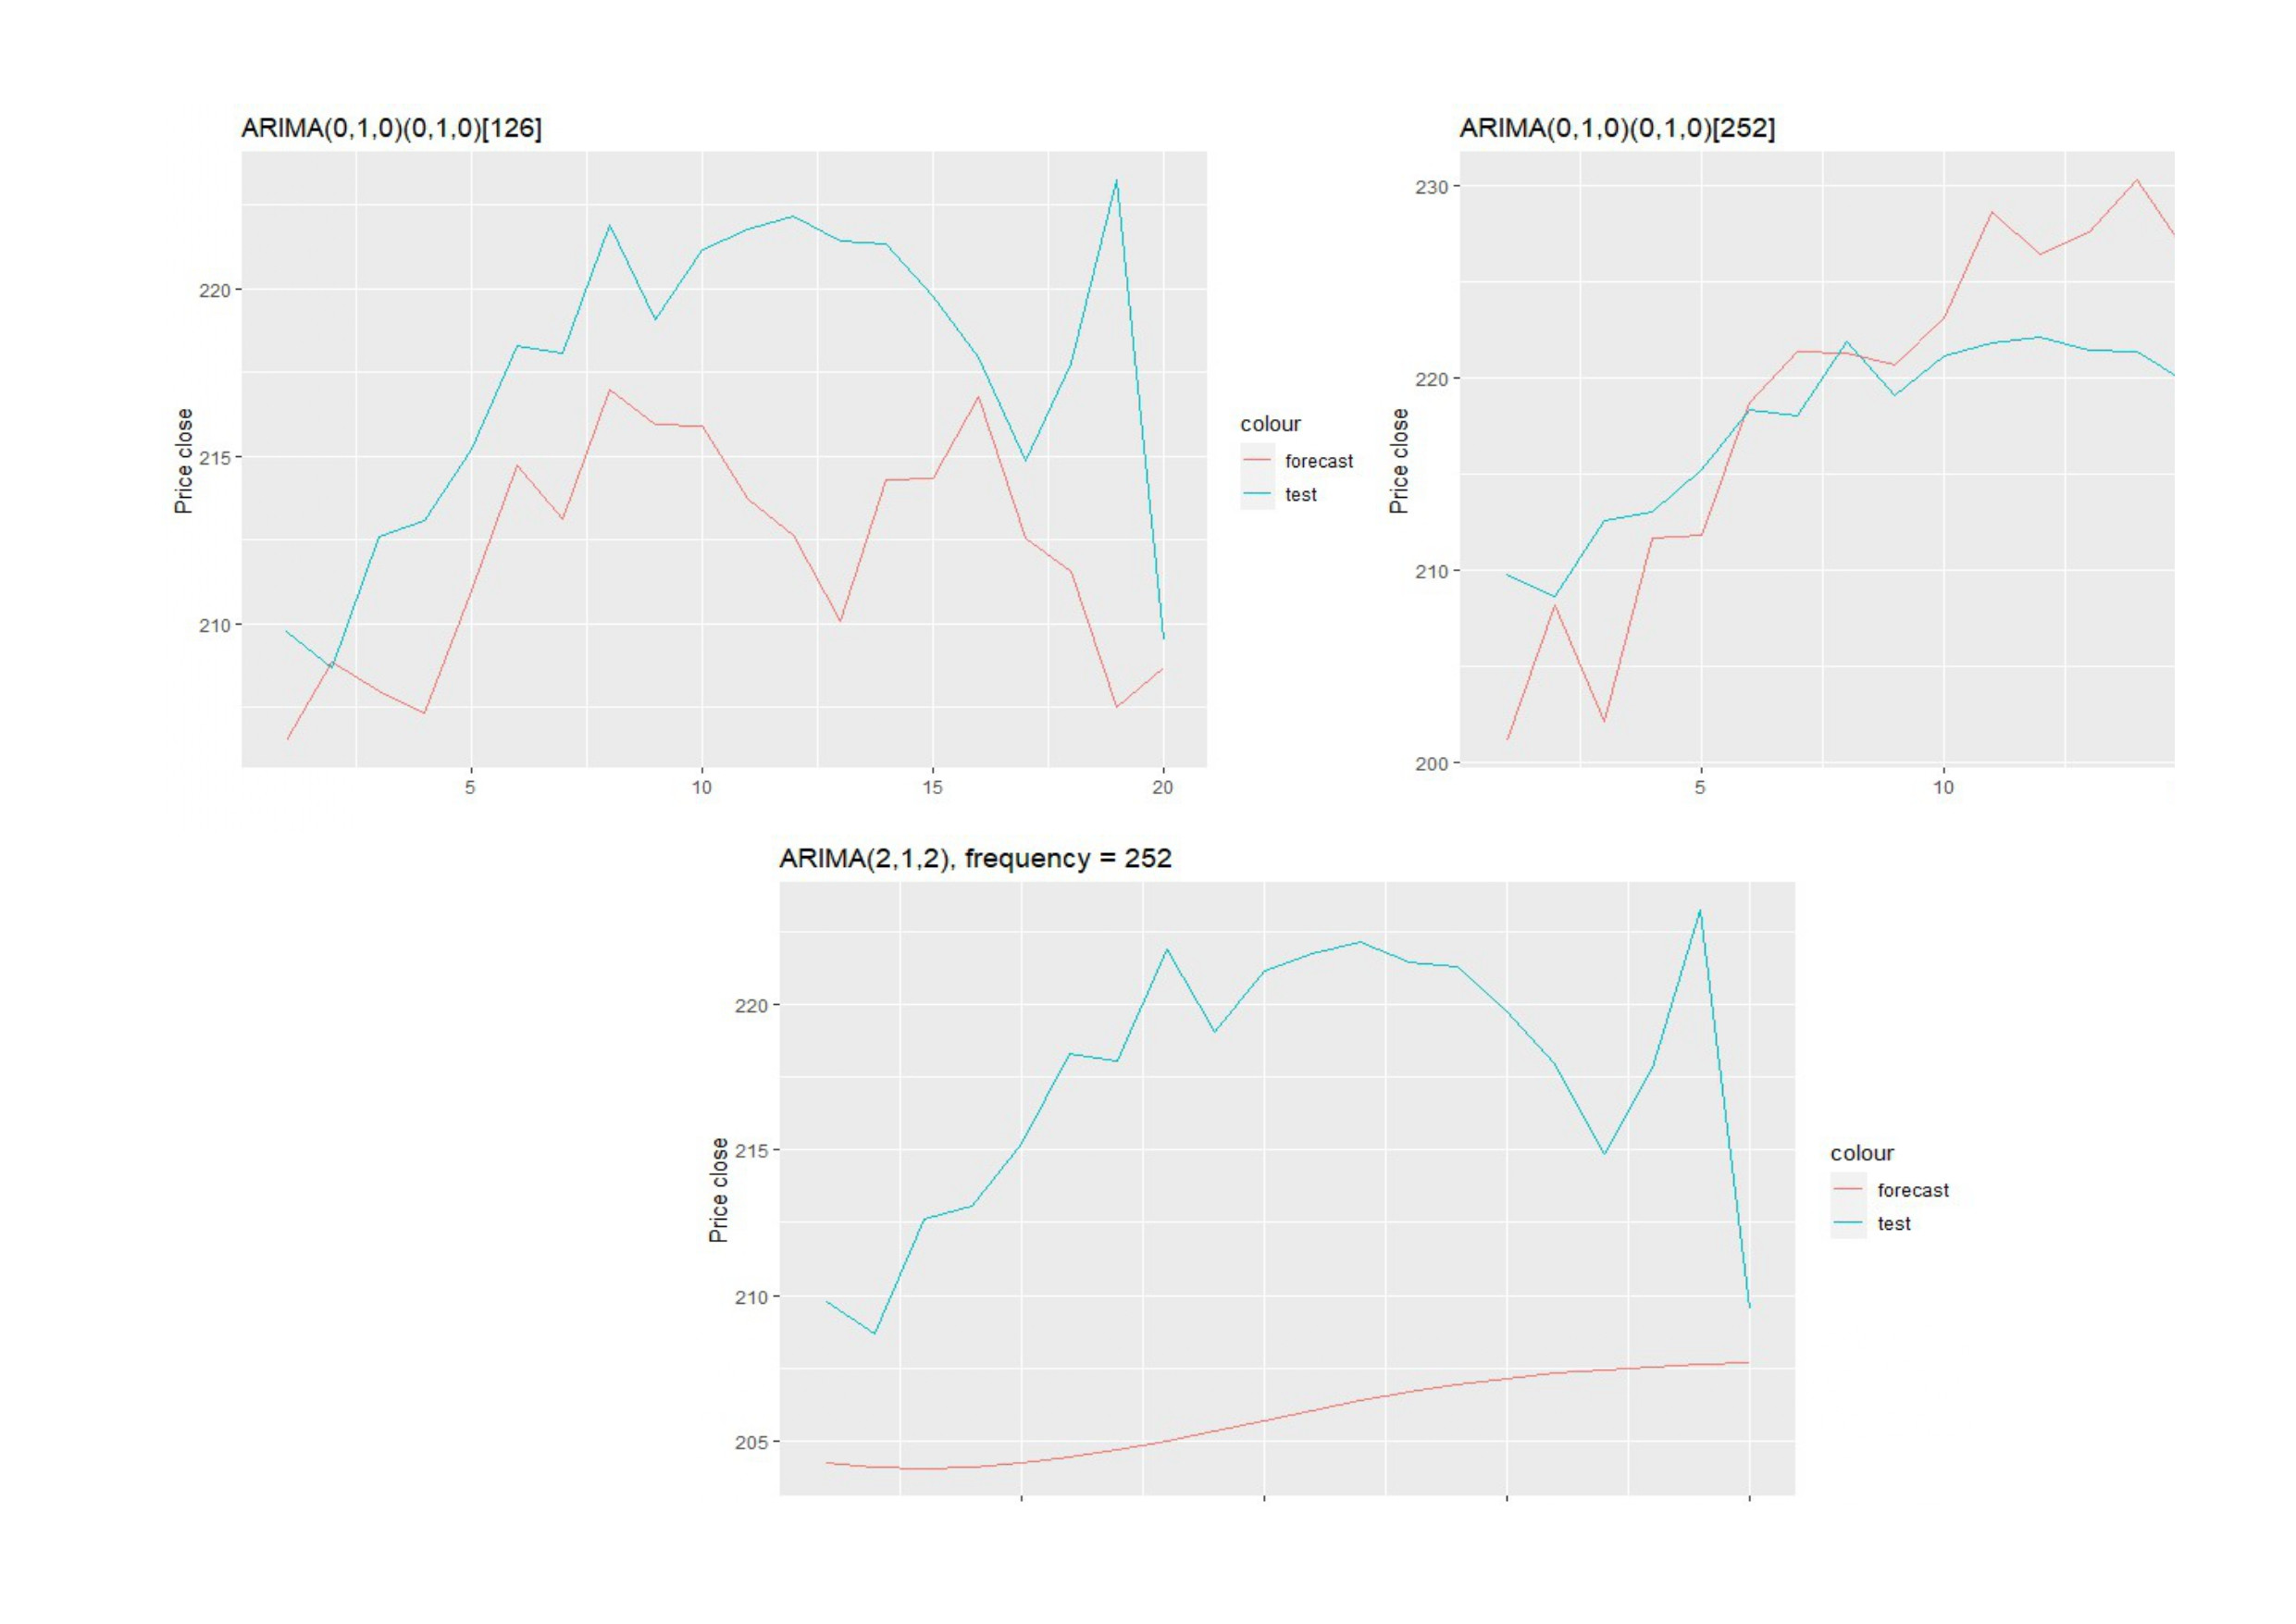
These are my experiments with auto.arima function:
Every time I wrote "D = 1" (whether frequency was 252 or 126), forcing seasonal differencing, I got higher AIC values, however, more accurate predictions. I am not saying that getting flat / almost flat lines is not appropriate, nevertheless, sometimes you want to know more than just an overall direction of your future forecast if it is possible.
I assume I have done plenty of mistakes and it is highly possible that the entire approach is not appropriate at all.
The major question is:
"Does it make sense to force seasonal differencing (D = 1) when it gives better forecast values (I compare them with a hold-out set, calculating MAPE, for instance) even if it seems to be unnecessary, owing to the fact that seasonality is insignificant?"


