3
$\begingroup$

I think MAD only can be used to detect anomalies for time series without a trend because it relies only a stable median to detect anomalies. It should be OK for time series with seasonality. Just seek confirmation here. This question is limited to when MAD is used as a standalone algorithm without coupling with other methods for anomaly detection.

MAD definition and use:

Suppose we have a set of observations: $(x_1,...,x_n)$
$$Median = median(x_1,...,x_n)$$ $$MAD = median(|x_1- Median|, |x_2- Median|,...,|x_n- Median|)$$

Then we can use $Median$ +/- 3*$MAD$ as thresholds to detect anomalies.

$\endgroup$
6
  • 2
    $\begingroup$ Well, Median Absolute Deviation from what? $\endgroup$ Commented Oct 28, 2020 at 19:07
  • $\begingroup$ @StephanKolassa This post describes MAD: towardsdatascience.com/… $\endgroup$
    – etang
    Commented Oct 28, 2020 at 19:26
  • 1
    $\begingroup$ Thank you. Do you have a source that does not require registration? Also, can you simply answer the question here, so later visitors to this thread do not need to rely on information elsewhere (links may rot)? $\endgroup$ Commented Oct 28, 2020 at 19:29
  • 1
    $\begingroup$ The MAD is conceptually for i.i.d. data, as are other scale functionals such as the standard deviation. It will not take into account time series dependence structure. You mention time series but don't really explain why you want to use MAD for them - it only makes sense (in the given standard form) if you ignore that it's a time series. $\endgroup$ Commented Oct 28, 2020 at 20:56
  • 1
    $\begingroup$ There are several common flavors of MAD, such as median absolute deviation from the mean. Regardless, in any time series not known to be stationary, use of the MAD (or any univariate statistic) to screen for "anomalies" sounds like an inferior strategy because it is more or less likely to confound the non-stationary behavior with anomalous behavior. An appropriate windowed form of a MAD, though, may indeed be useful. $\endgroup$
    – whuber
    Commented Oct 28, 2020 at 21:08

1 Answer 1

6
$\begingroup$

As said in the comments, using MAD as you proposed assumes that you are dealing with i.i.d. variables. For time series this is obviously not the case, as the time-series changes over time, so the method would not be appropriate. What you could do instead, and is commonly done, is to adapt the approach to the fact that the distribution of the time-series changes over time.

  • If you can assume, that the only thing that changes over time is the mean, than you could detrend the data first and then use the method like MAD. To do this, you would first need to estimate the trend of the time-series and subtract it from the data. For doing this, you could use something like rolling average, exponential smoothing, LOESS, or a number of other methods, depending on the mature of your data. One such example is given by Rob Hyndman in the answer to the Simple algorithm for online outlier detection of a generic time series question.

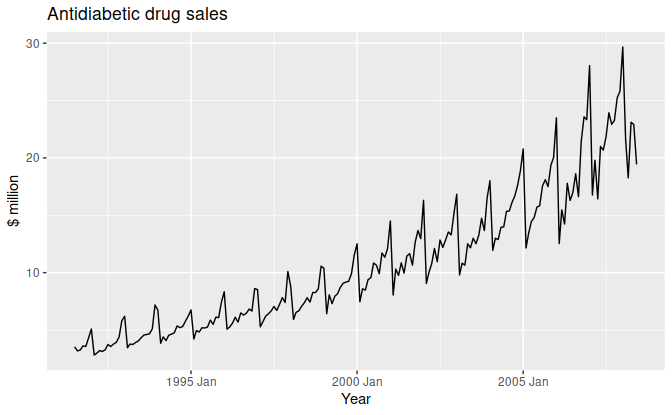
  • However, it also can be the case that not only trend, but also variability of the time-series changes over time (see example below, taken from the Forecasting: Principles and Practice book by Rob Hyndman and George Athanasopoulos). In such case the whole distribution changes over time, so you need a method to account for that as well. Simple solution is to do windowed estimates (e.g. split your data to daily, weekly, monthly etc. periods and do local anomaly detection within the windows).

enter image description here

  • Another case is if there is seasonality in your data. Then you need to do seasonal anomaly detection (how does this example differ from the data we usually observe on Mondays, or in August, or on 8 AM, etc).

Of course, in real-life data it might be the case that you would need a mix of those approaches, or a tailor-made approach for your data. The key take-away message is that you need to consider how does the distribution of your data changes over time. It is rather not i.i.d., otherwise you would not consider it as a time-series, so using MAD directly is a bad idea.

$\endgroup$

Your Answer

By clicking “Post Your Answer”, you agree to our terms of service and acknowledge you have read our privacy policy.

Not the answer you're looking for? Browse other questions tagged or ask your own question.