2
$\begingroup$

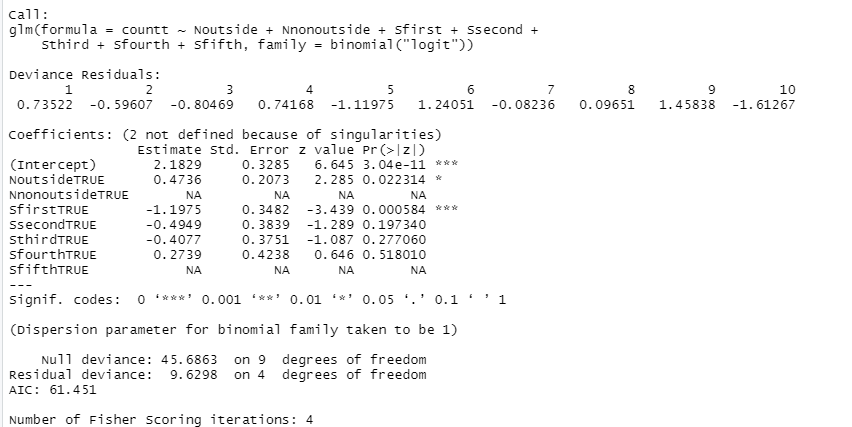
I'm running a glm in R with two categorical variables, one of which is binary, the other of which can take on five values. I would like it so that my model returns an intercept value that reflects the case where my binary variable is "off," and where each of my five categories is provided an increase/decrease based on whether it is off or on (only one can be on at a time). Currently, I have succeeded in the first task, but I believe that my model is assuming a default of the fifth category being on, which I do not want. The results of my regression are below:

enter image description here

And the code to make it:

## GLM with Five Quintiles in One Regression

S = factor(rep(c("first","second","third", "fourth", "fifth"),c(2,2,2,2,2)))
Sfirst = (S=="first")
Ssecond = (S=="second")
Sthird = (S=="third")
Sfourth = (S=="fourth") 
Sfifth = (S=="fifth")

N = factor(rep(c("outside", "nonoutside"), 5))
Noutside = (N=="outside")
Nnonoutside = (N=="nonoutside")

yt = c(79, 73, 73, 69, 103, 73, 127, 61, 111, 36) 
nt = c(15, 31, 11, 10, 15, 8, 7, 5, 4, 8)

countt = cbind(yt, nt)
print(countt)

resultt = glm(countt ~ Noutside + Nnonoutside + Sfirst + Ssecond + Sthird + Sfourth + Sfifth, family = 
binomial("logit"))
summary(resultt)

My question: what is considered the "proper" way to create a dummy variable for this regression such that Sfifth is also assigned an estimate, as opposed to being baked into the intercept value, as it seems like it currently is. Any suggestions would be sincerely appreciated.

$\endgroup$
0

1 Answer 1

3
$\begingroup$

For what it is worth, the simple answer is: you can't. Your columns are linearly dependent, and you run into multicollinearity/incidential parameter issues.

For instance,

df <- data.frame(Noutside, Nnonoutside, Sfirst, Ssecond, Sthird, Sfourth, Sfifth)
cor(df)

            Noutside Nnonoutside Sfirst Ssecond Sthird Sfourth Sfifth
Noutside           1          -1   0.00    0.00   0.00    0.00   0.00
Nnonoutside       -1           1   0.00    0.00   0.00    0.00   0.00
Sfirst             0           0   1.00   -0.25  -0.25   -0.25  -0.25
Ssecond            0           0  -0.25    1.00  -0.25   -0.25  -0.25
Sthird             0           0  -0.25   -0.25   1.00   -0.25  -0.25
Sfourth            0           0  -0.25   -0.25  -0.25    1.00  -0.25
Sfifth             0           0  -0.25   -0.25  -0.25   -0.25   1.00

shows you that Noutside and Nnonoutside is perfectly correlated, which is why one of them gets dropped. Similarly, as you fit the regression with a constant, the inclusion of all S levels introduces the linear dependency. See

df[, 3:7]
   Sfirst Ssecond Sthird Sfourth Sfifth
1    TRUE   FALSE  FALSE   FALSE  FALSE
2    TRUE   FALSE  FALSE   FALSE  FALSE
3   FALSE    TRUE  FALSE   FALSE  FALSE
4   FALSE    TRUE  FALSE   FALSE  FALSE
5   FALSE   FALSE   TRUE   FALSE  FALSE
6   FALSE   FALSE   TRUE   FALSE  FALSE
7   FALSE   FALSE  FALSE    TRUE  FALSE
8   FALSE   FALSE  FALSE    TRUE  FALSE
9   FALSE   FALSE  FALSE   FALSE   TRUE
10  FALSE   FALSE  FALSE   FALSE   TRUE

rowSums(df[, 3:7])
 [1] 1 1 1 1 1 1 1 1 1 1

the latter of which is identical to the constant.

$\endgroup$
1
  • $\begingroup$ Thanks for your response! What you explained makes sense, as this is an issue that I encountered on paper (before coding it). $\endgroup$
    – scoopfaze
    Commented Jan 10, 2021 at 3:44

Your Answer

By clicking “Post Your Answer”, you agree to our terms of service and acknowledge you have read our privacy policy.

Not the answer you're looking for? Browse other questions tagged or ask your own question.