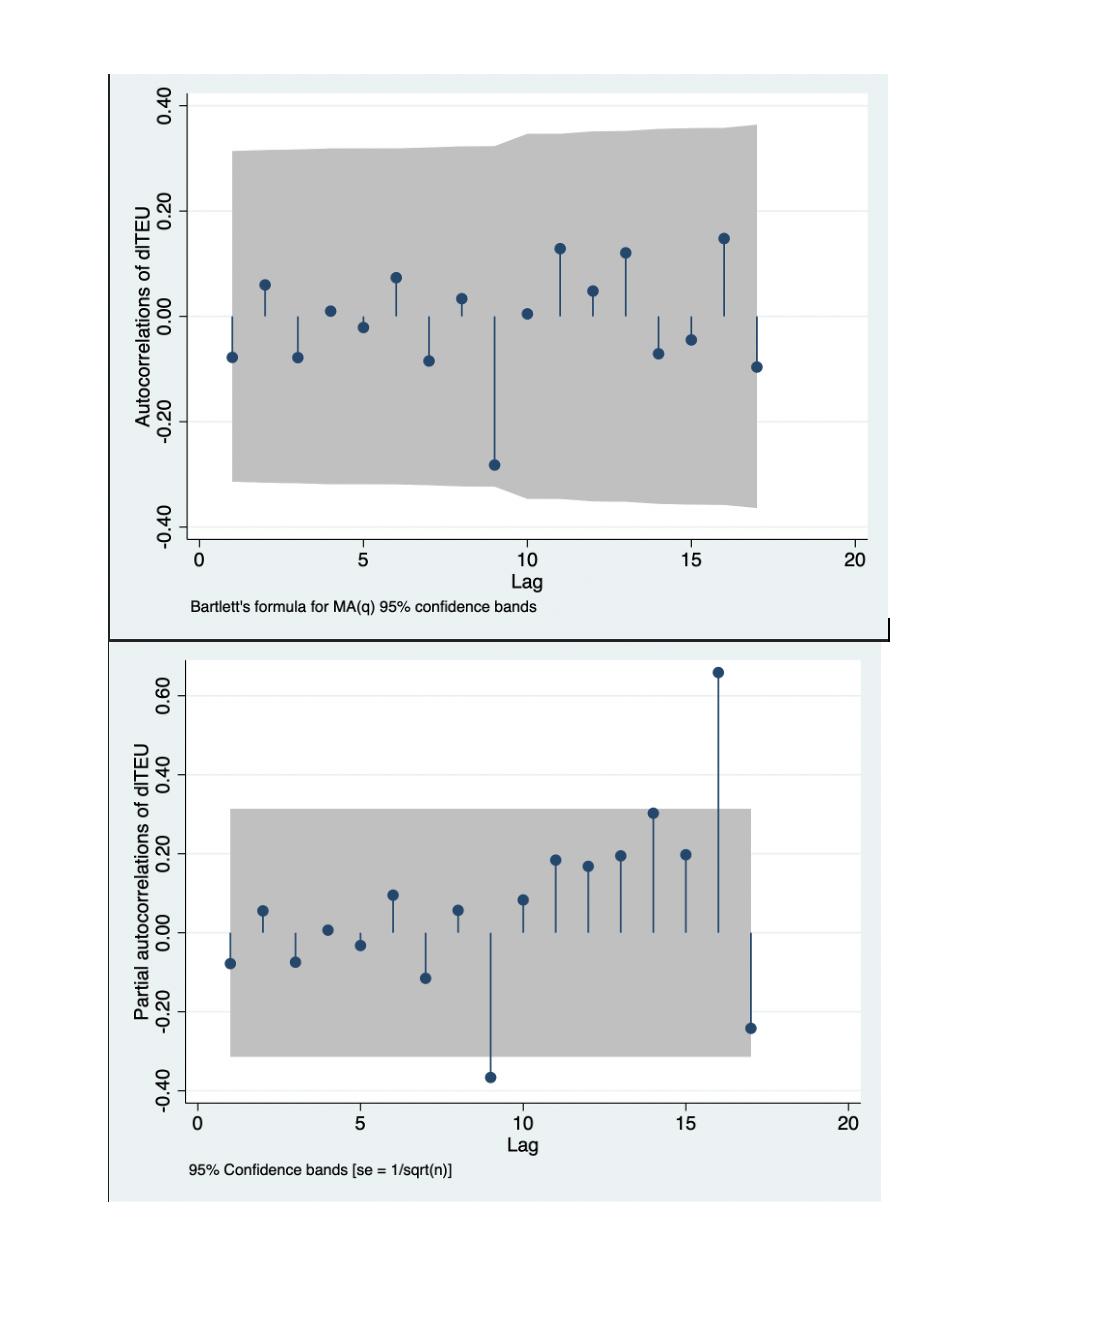
I differenced the variable (univariate model) in question because it was not stationary. I ran the dickey-fuller unit root test to check for stationarity, and it looks like the differenced version is stationary. However, when I make the acf and pacf plots to determine the model, I get these bizarre results that I do not know how to interpret. Could someone please help me understand?
-
1$\begingroup$ Please describe what particular aspects of these plots strike you as "bizarre." $\endgroup$– whuber ♦Commented Jan 22, 2021 at 21:35
-
$\begingroup$ Well, usually if it is an MA or AR model, there would be some sort of decay trending to 0. As you can see in the PACF plot, the values are increasing, rather than decreasing. I've looked through several sources on the internet and none have this type of graph. $\endgroup$– amvoightCommented Jan 22, 2021 at 21:52
1 Answer
Since you provided ACF and PACF plots only for differentiated time series, so I can't tell you anything about the original one.
As you can clearly see on the plots, there's no significant autocorrelations in your time series (i.e. values for first lags are not significant). So, you have to choose $p=q=0$ in ARIMA model.
But there's something that points to possible seasonality existence - significant PACF for lags 9 and 16. However, this is only a hypothesis and it needs to be checked more precisely by using, for instance, spectral analysis. But first you need to explore ACF and PACF for more lags.
One more thing to check. What implies a non-stationarity in an original series? Maybe it was a deterministic trend that should be removed just by subtracting it instead of differentiating. Subtracting deterministic trend preserves more information in the processed time series.
-
$\begingroup$ Can I ask why I should use ARIMA, rather than MA or AR models? Could there still be seasonality if the data is annual -- taken on the first of the same month every year? The original data had a linear, upward-sloping trend, so maybe I can fit a linear OLS model to it and subtract? Thanks for helping! :) $\endgroup$– amvoightCommented Jan 22, 2021 at 21:57
-
$\begingroup$ @amvoight AR and MA are just "submodels" of ARIMA: AR(p) = ARIMA(p, 0, 0), MA(q) = ARIMA(0, 0, q), that's why I speak in terms of ARIMA. Data can have a complicated seasonality, so you probably have to deal with spectral analysis to get more information about frequencies involved. Speaking about trend in your case, you can fit, as you said linear model. Note, that you might have some slightly quadratic trend (not linear at all) $\endgroup$ Commented Jan 22, 2021 at 22:17

