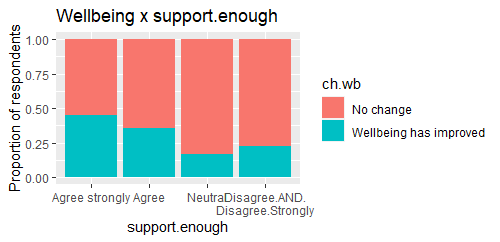
I'm running a logistic regression in R. The data for the model comes from survey responses. The response variable is 'change in wellbeing' and the predictor variables are derived from several other questions from the survey. The main goal of this analysis is to identify good predictors of wellbeing increase.
We have a total of 720 responses to the survey. We have fitted 20 covariates in the model. Almost all of these covariates are categorical, and some of them are ordered categorical variables (e.g. likert scale: strongly agree, agree, neutral, disagree, strongly disagree).
The coefficients for levels of some of the covariates don’t make sense to me. For example, one of our covariates is ‘do you receive enough support in your activities’, in the R code this variable is named ‘support.enough’. Respondents answered this question on a likert scale. Please note - for the analysis we merged the 'disagree' and 'strongly disagree' categories.
This variable plotted against the response variables is presented below. People who agree and agree strongly that they receive enough support are more likely to report an increase in wellbeing than those who are neutral or disagree.

Strongly agree is the reference level. Based on this I would expect the coefficients for each level of this covariate to all be negative. However the coefficients and standard errors are as follows:
                                                                 Estimate Std. Error
    support.enoughAgree                                         0.5040895  0.2954718
    support.enoughNeutral                                      -0.1778296  0.4380676
    support.enoughDisagree.AND.Disagree.Strongly               -0.6018862  0.6103662
My understanding is that this output is suggesting that those who 'agree' that they receive enough support are more likely to report an increase in wellbeing than those who 'strongly agree'.
I’ve been trying to understand why there is an obvious discrepancy between the data and the coefficients. From doing some reading around, I believe that multicollinearity could be causing issues, however, my understanding is that this would inflate the standard error around the coefficient rather than the estimate itself. VIF=3.58 of the variable shown above. I’m also thinking that I could be using too many covariates, given the size of the dataset.
There are four other covariates in the model where a similar thing is happening.
My questions are:
- Why are the coefficients disagreeing with the data?
- Is this a cause for concern?
- Am I interpreting this incorrectly?
I’ve seen a few other questions about logistic regression coefficients, but I didn’t think any of them quite matched what is going on with this model.
