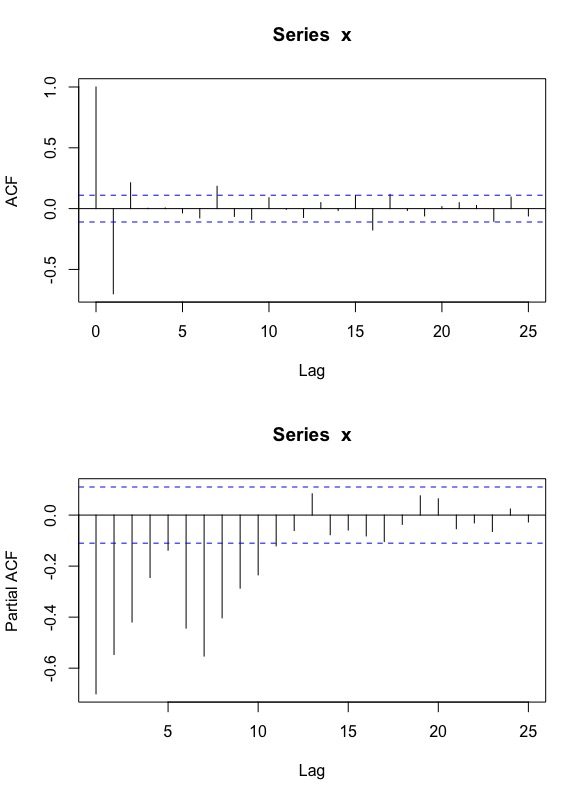
I have a time series with the following ACF and Partial ACF plots; however, I am a little confused on how to interpret these.
I called the following commends:
acf(x_values)
pacf(x_values)
I believe I can use the $x$-values of my data instead of the residuals. Is that correct?
My thoughts:
- The ACF plot shows that the model does a satisfactory job based on the autocorrelation. It is clear that lags $l = 0, 1, 2$ are significant with a couple other lags in the distance (is this a result of cyclical behavior???).
- The PACF plot shows more of a weekly cyclical pattern, as each observation refers to one day.
Is what I am saying above correct? Am I producing and interpreting these plots correctly?

