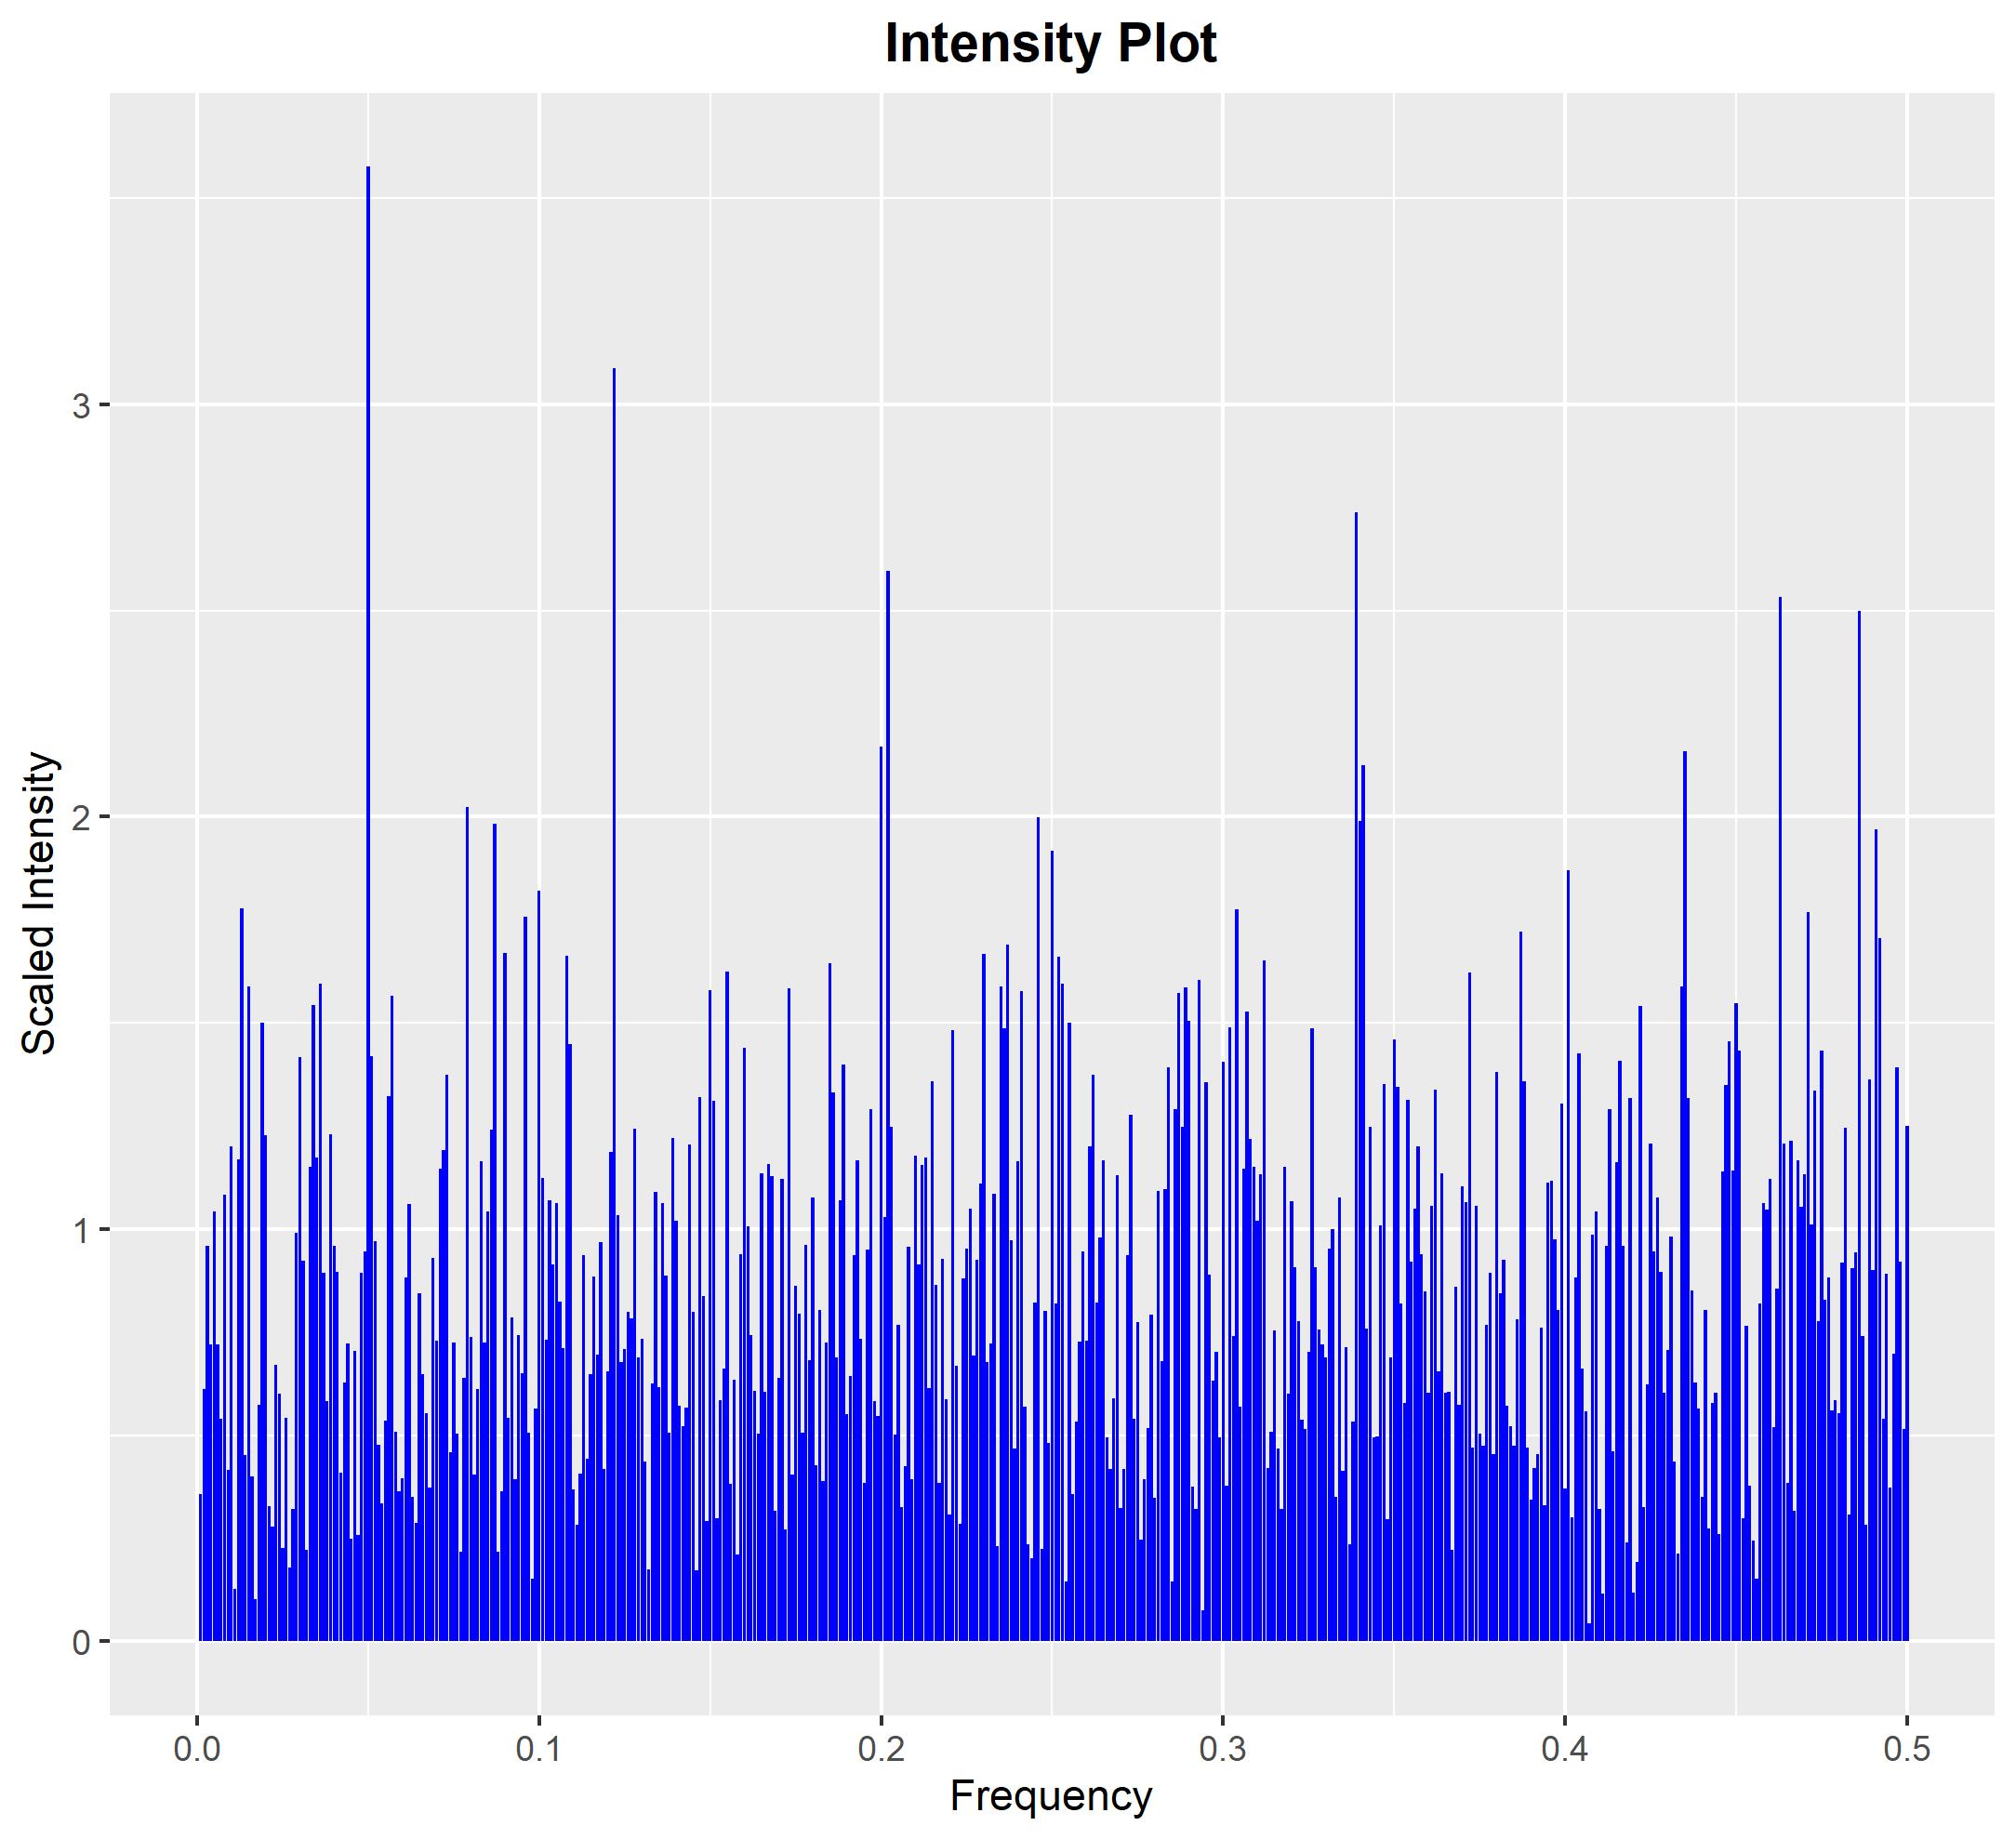
Periodicity in a time-series generally manifests itself in one or more "spikes" in the intensity of the signal when represented in the frequency domain. In fact, from the theory of Fourier series representation we know that a periodic signal can be well approximated by a linear combination of one or more sinusoidal signals that will appear as "spikes" in the frequency domain.
Now, this is complicated by the fact that random data will also give you some spikiness in the frequency domain, so the goal is to distinguish between spikiness that is due to randomness and spikiness that is due to periodicity. To do this we would typically use the maximum signal intensity as a test statistic for testing periodicity --- the larger the maximum signal intensity the more evidence there is for at least one sinusoidal signal in the data (and therefore at least some periodicity).
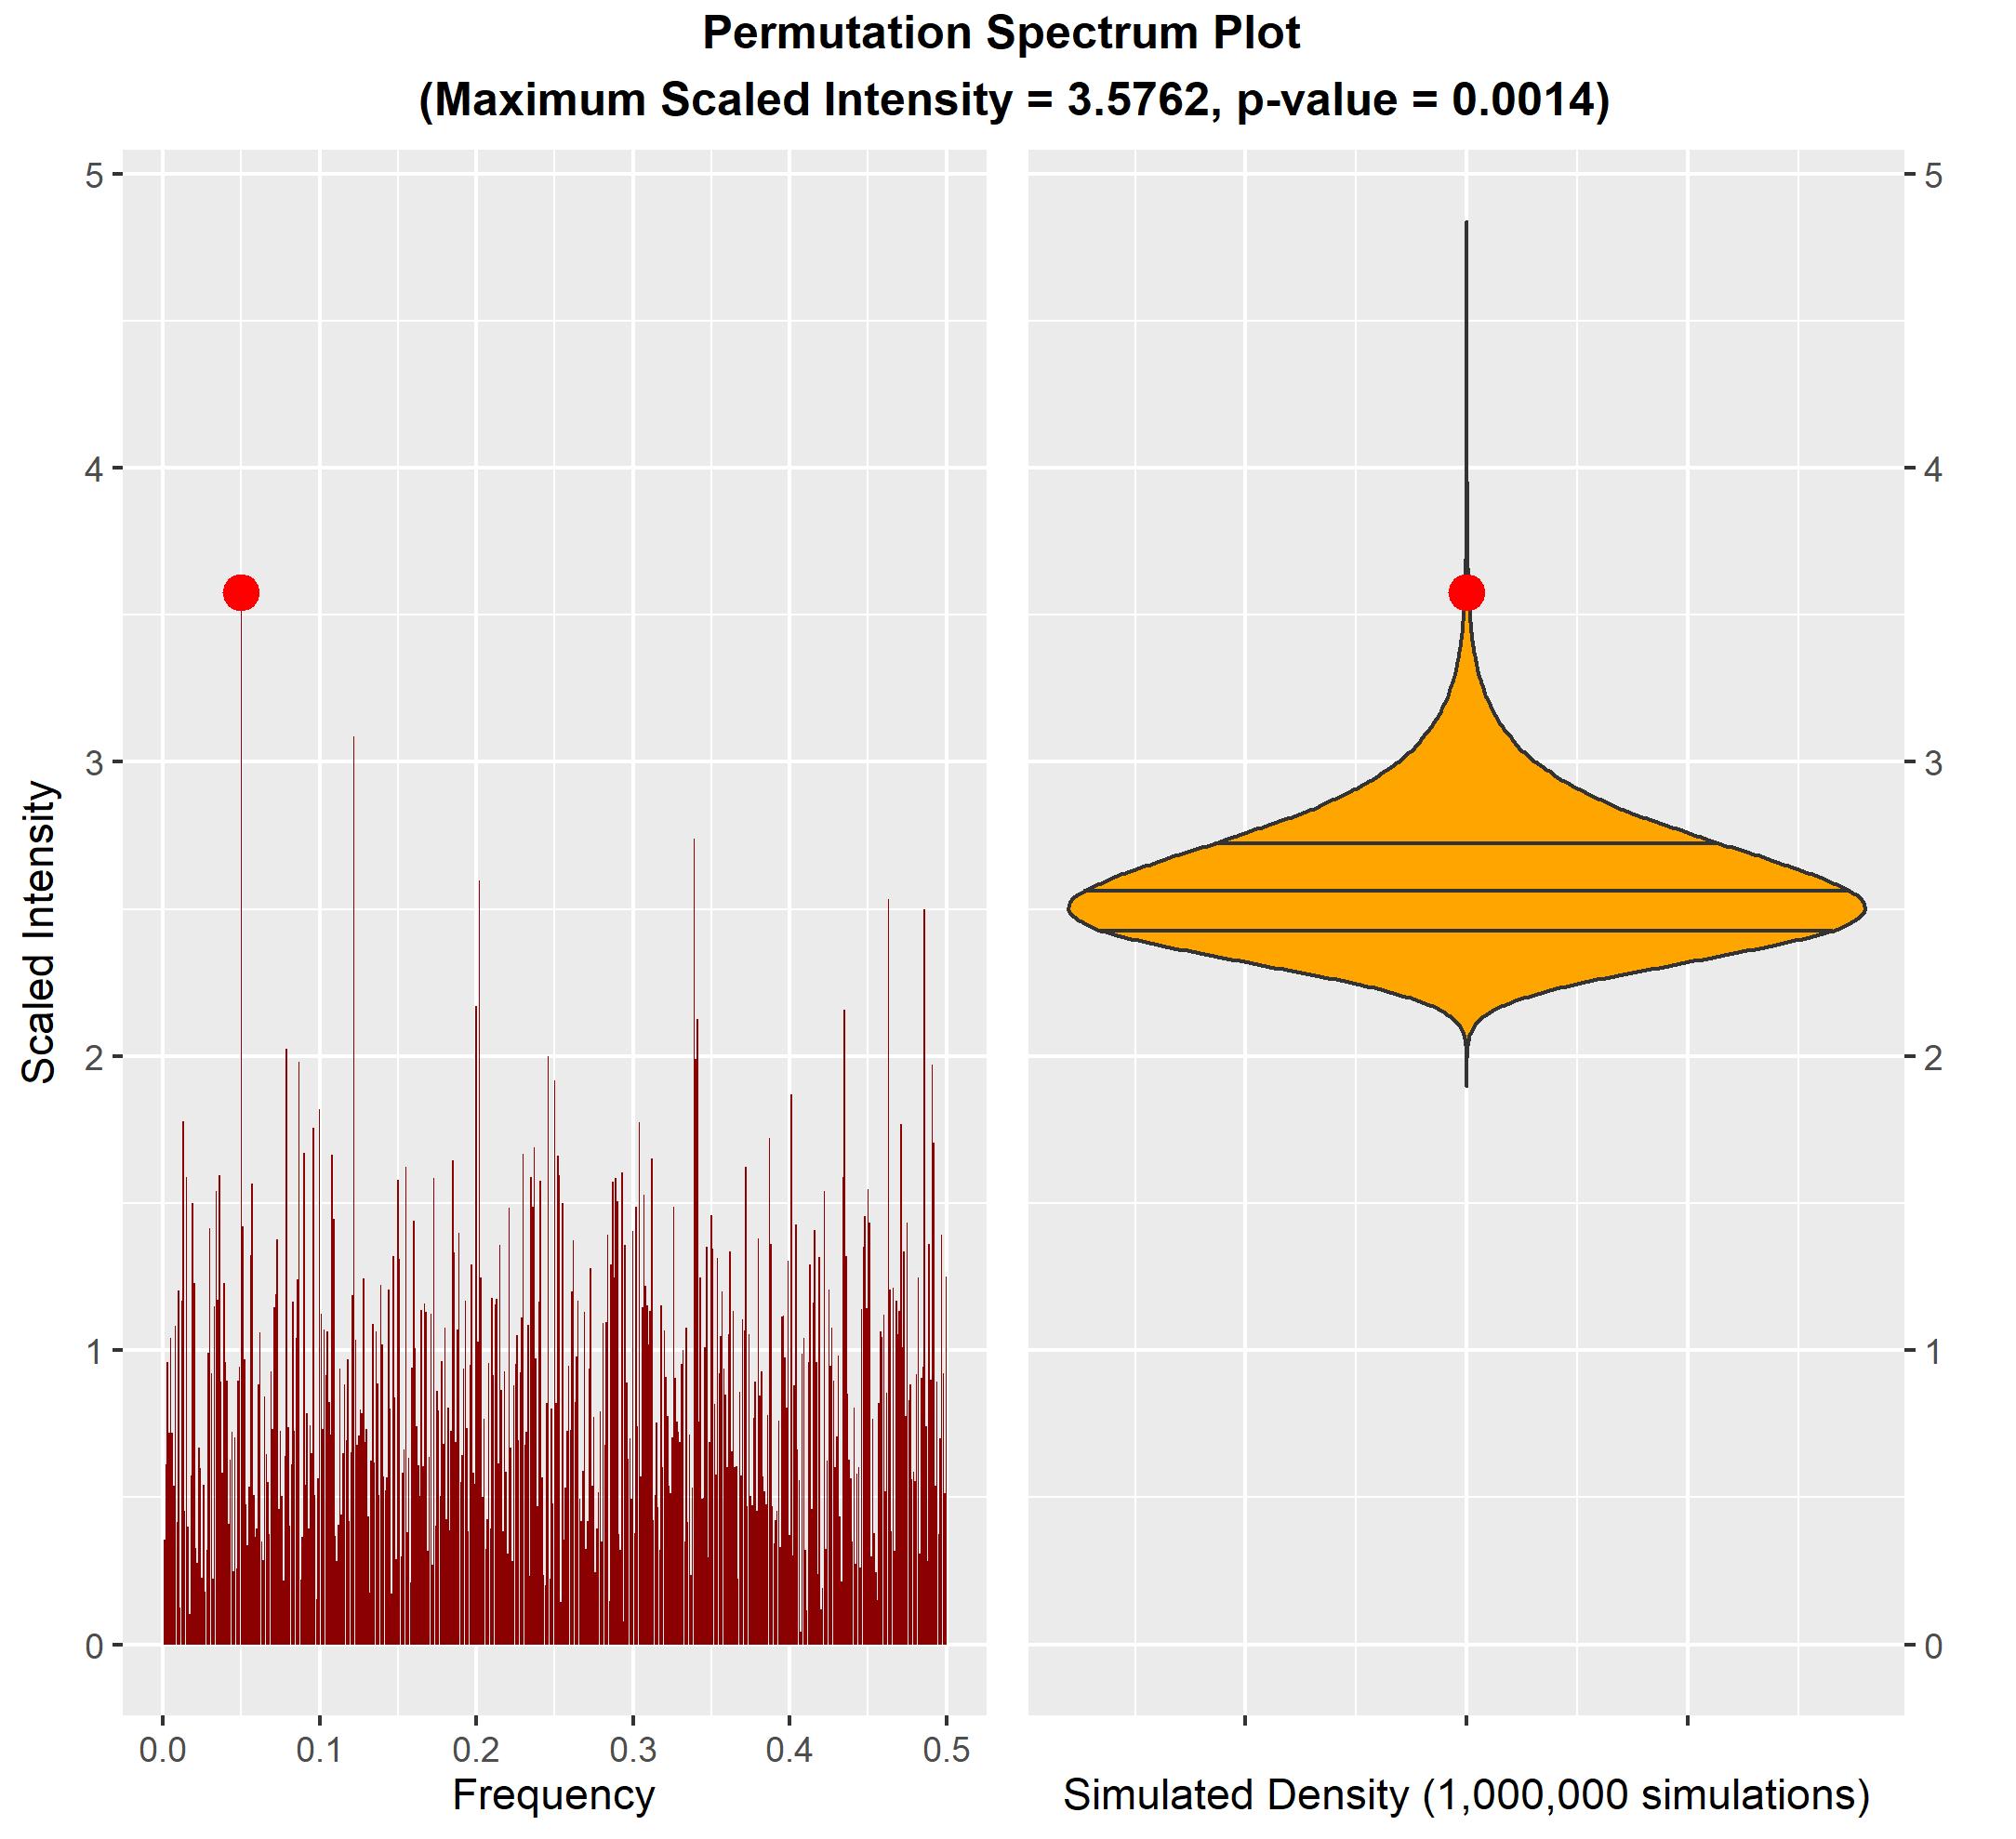
One useful formal test for this purpose is the "permutation spectrum test" which tests the maximum signal intensity against its null distribution under the assumption of exchangeability of the values in the signal (see O'Neill 2020). This particular test does not make any assumption about the marginal distribution of the data, so it is not restricted to testing Gaussian time-series. The null hypothesis for the test is that the time-series values are exchangeable and the alternative hypothesis is that there is at least one periodic signal in the time-series. (It may be useful to remove trends before applying this test.)
Implementation in R: You can use the ts.extend package in R to produce and plot the signal intensity for a time-series or conduct the permutation-spectrum-test. To show you an example of this, let's first produce a time-series with a periodic component.
#Generate periodic part and random part of time-series
set.seed(1)
n <- 1000
A <- rep(1:20, 50)
E <- rgamma(n, shape = 2, scale = 30)

#Generate time-series with periodic part
a <- 1
X <- a*A + E
It is simple to produce and plot the intensity of the series in the frequency domain to see if there are any "spikes" giving evidence of a periodic component.
#Show intensity of time-series
library(ts.extend)
INTENSITY <- intensity(X, scaled = TRUE)
plot(INTENSITY)

We can see that there are some spikes at particular frequencies in the Fourier domain, but are they big enough to falsify the assumption that this is exchangeable noise? To test this we implement the permutation-spectrum test and produce an appropriate plot. In the present case the test correctly identifies strong evidence that there is at least one signal in the data. (The p-value for the test is $p=0.001385$.)
#Implement the permutation-spectrum test
TEST <- spectrum.test(X)
plot(TEST)
TEST

        Permutation-Spectrum Test

data:  real time-series vector X with 1000 values
maximum scaled intensity = 3.5762, p-value = 0.001385
alternative hypothesis: distribution of time-series vector is not exchangeable
(at least one periodic signal is present)


