4
$\begingroup$

I am working on a problem where I have to first classify whether a time-series is periodic or not and then, if it is periodic identify its period(s) (the time-series could have multiple periodicities, also).

I need a reliable approach to say that a time-series is not periodic. I have been searching about this topic and these are some leads:

Are there some other properties of time-series that can be used?

$\endgroup$
2
  • $\begingroup$ I would love some of the promising citations you have seen for your two bullet points. :) Also: Welcome to CV, Hari. $\endgroup$
    – Alexis
    Commented Mar 12, 2021 at 7:46
  • $\begingroup$ Please, see the updates. $\endgroup$
    – Hari
    Commented Mar 12, 2021 at 7:54

2 Answers 2

3
$\begingroup$

I would approach the problem "check if a time-series is not periodic" as follows

Maybe this is a bit naive approach but for, at least a simple case, it seems to work (see example below).

Example

As minimal test for this 2-stages approach we could see how it works if we have the following 2 series:

  • Periodic series: $y_{i}^{(1)} = \sin(x_{i}) + \epsilon_{i}$
  • Non periodic series: $y_{i}^{(2)} = \alpha + \beta x_{i} + \epsilon_{i}$

where $x_{i} = [-2\pi, 2\pi]$ and $\epsilon_{i} \sim N(0, \sigma^{2})$ and $i = 1,...,N$.

Below you will find a R code for these settings. The harmonic test is performed for the two series using the PML package.

library(PML)
N  = 100
x  = seq(-2*pi, 2*pi, len = N)
ep = rnorm(N) * 0.25
y1 = sin(x) + ep
y2 =  x + 0.5 + ep 

re1 = test.harmonic(y1, p = 0.025/(N - 1)) # p: correct for multiple freq 
re1$sig
       
        frequency     prop (g)  p-value     p-threshold
      1 50.000000 0.3565748 3.148508e-08 0.0002525253
      2  2.857143 0.0316902 1.000000e+00 0.0002525253

re2 = test.harmonic(y2, p = 0.025/(N-1))
re2$sig 
      
      frequency  prop (g)      p-value  p-threshold
      1 100     0.2077127   0.0006863734 0.0002525253

From the results above we notice that for $y^{(1)}$ we have one significant frequency while for the linear function we do not find any.

I hope this answer helps (maybe it does not solve your problem but suggests a possible line of investigation).

$\endgroup$
3
  • 2
    $\begingroup$ A major limitation of this answer is that it assumes normally distributed data and it also assumes that the periodic component is a perfect sine wave. There are many periodic series that would not be identified as periodic under this restriction. (One slight additional complication --- if $\beta=0$ then the series $y_i^{(2)}$ is (trivially) periodic.) $\endgroup$
    – Ben
    Commented Feb 14, 2022 at 20:34
  • 2
    $\begingroup$ Hi thanks for the remarks and the nice answer below!..I will try the permutation test. I replied to the question some time ago while reading Fisher’s paper $\endgroup$
    – Gi_F.
    Commented Feb 14, 2022 at 21:42
  • $\begingroup$ This is also a nice answer, notwithstanding the limitations. I suspect that this particular test might perfom badly on data that is far from a normal distribution, but helpful to look at it nonetheless. $\endgroup$
    – Ben
    Commented Feb 15, 2022 at 0:52
1
$\begingroup$

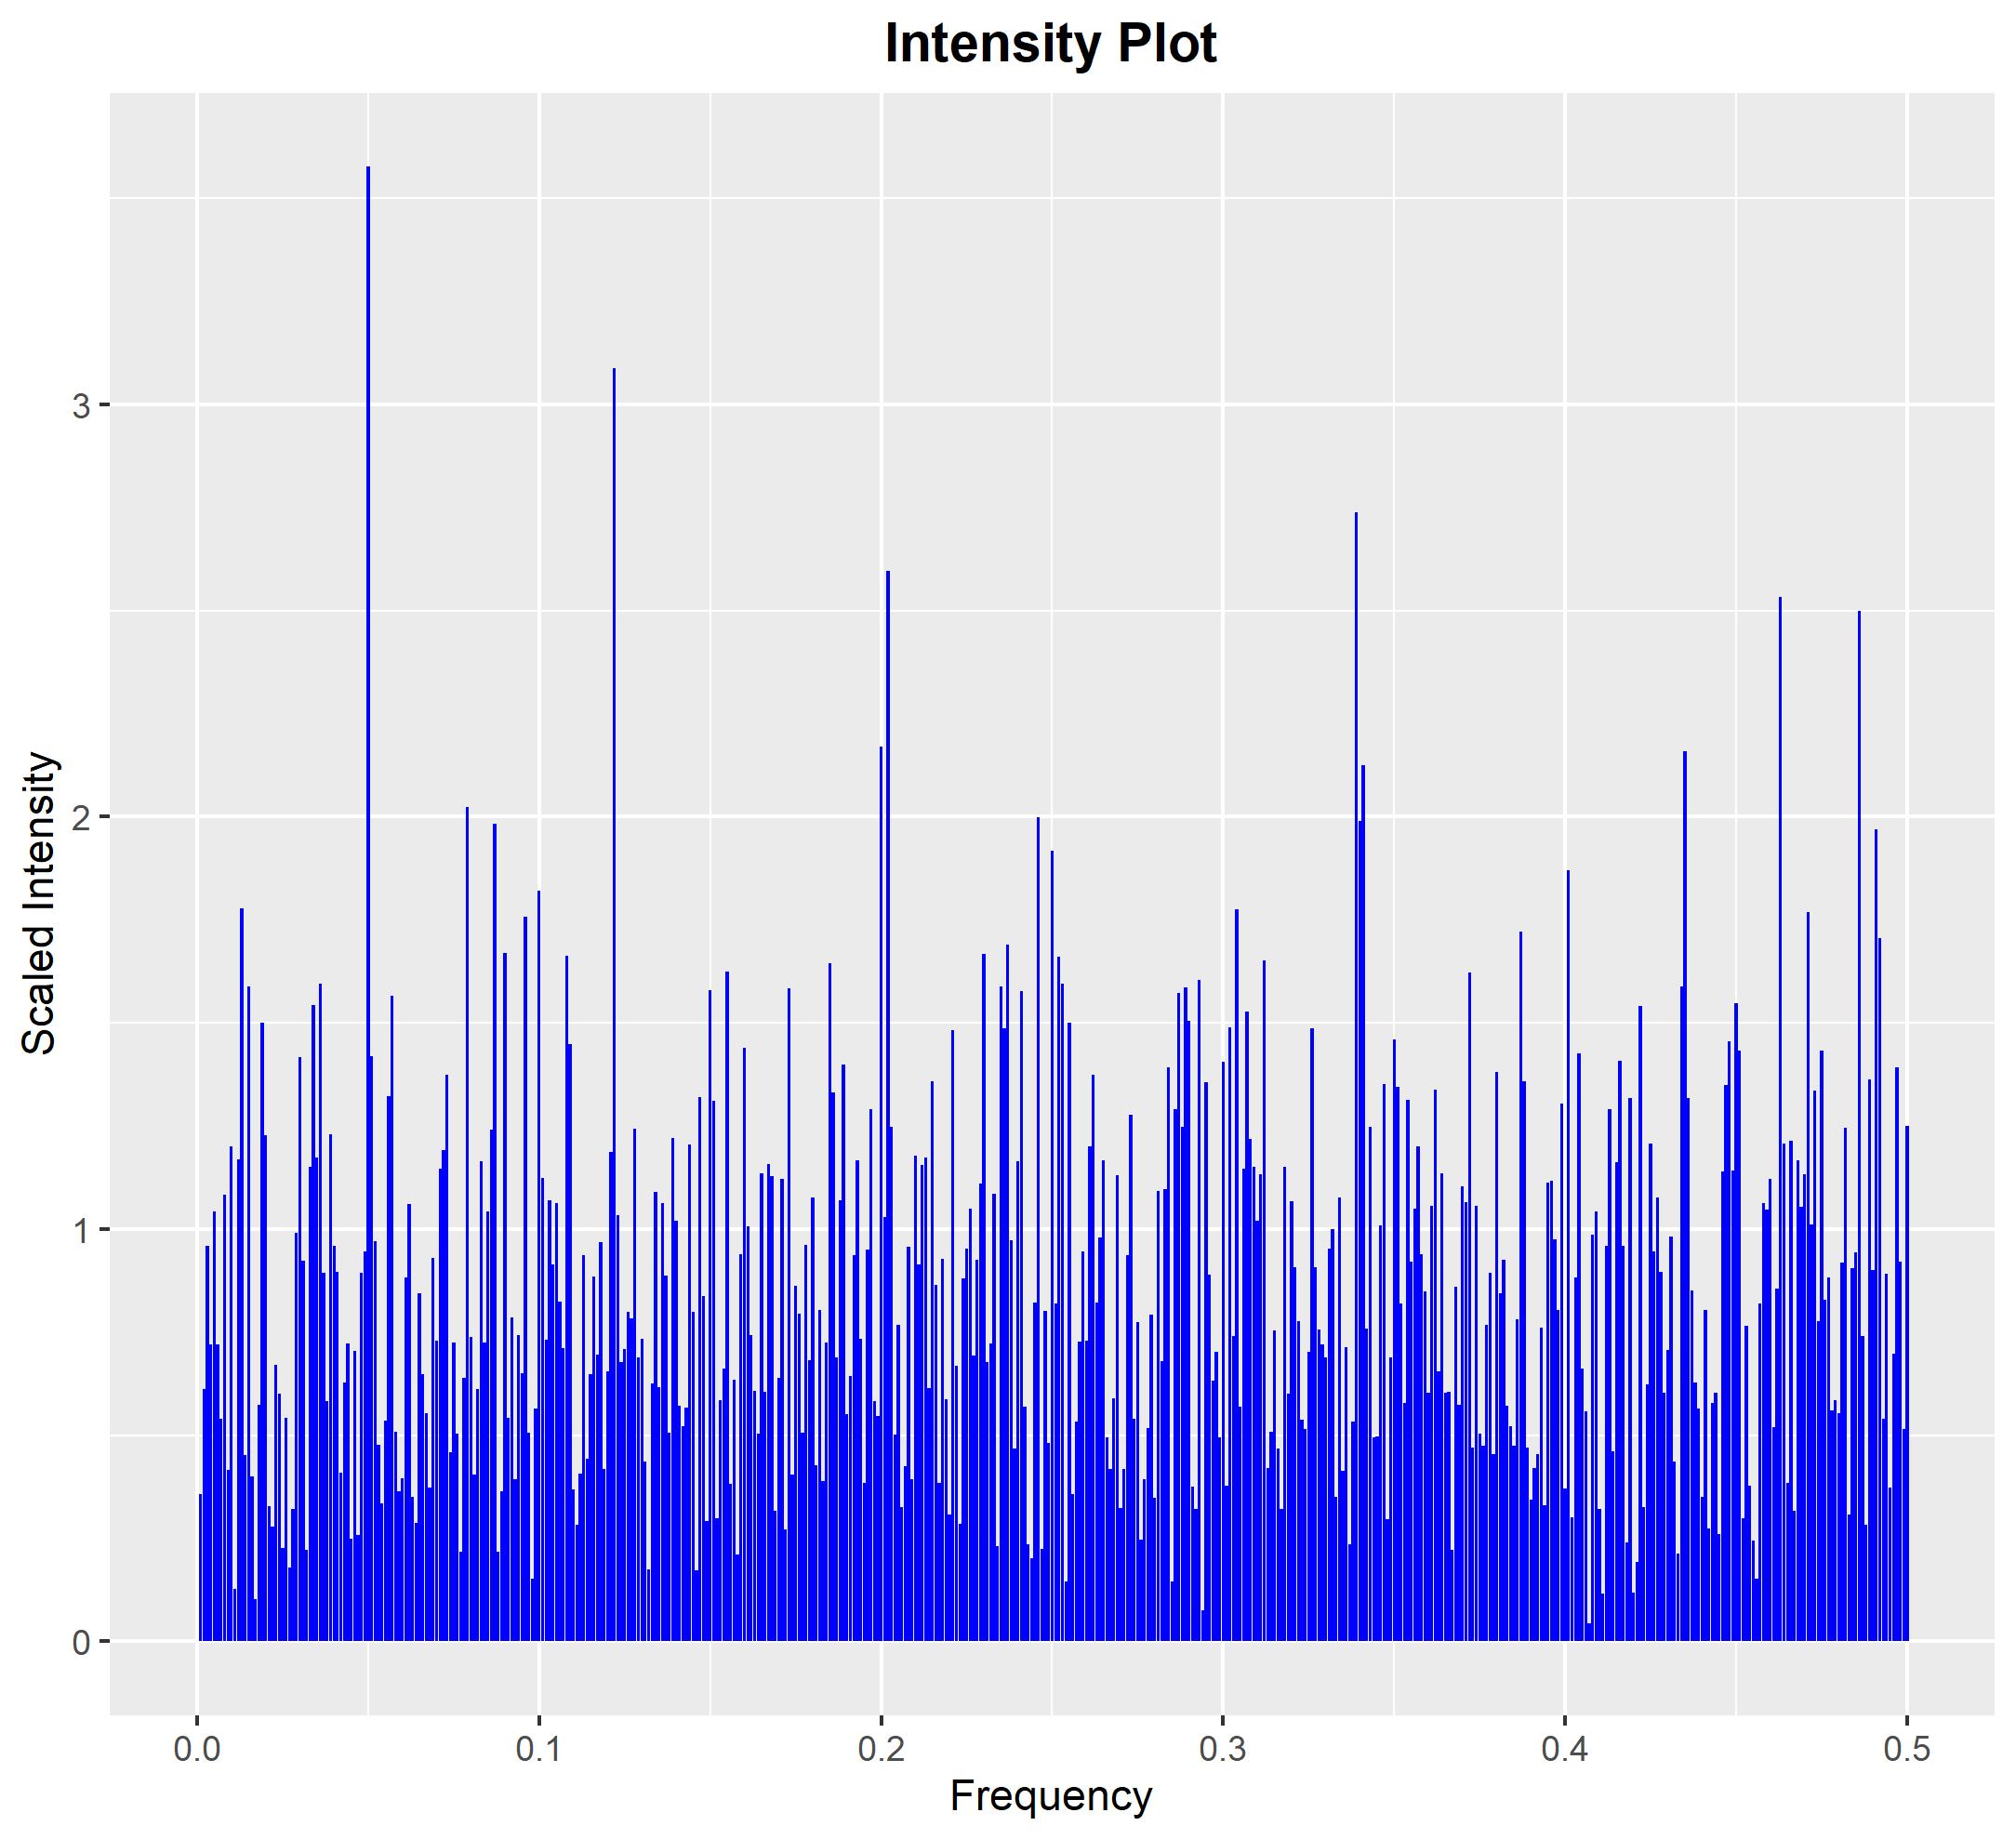
Periodicity in a time-series generally manifests itself in one or more "spikes" in the intensity of the signal when represented in the frequency domain. In fact, from the theory of Fourier series representation we know that a periodic signal can be well approximated by a linear combination of one or more sinusoidal signals that will appear as "spikes" in the frequency domain. Now, this is complicated by the fact that random data will also give you some spikiness in the frequency domain, so the goal is to distinguish between spikiness that is due to randomness and spikiness that is due to periodicity. To do this we would typically use the maximum signal intensity as a test statistic for testing periodicity --- the larger the maximum signal intensity the more evidence there is for at least one sinusoidal signal in the data (and therefore at least some periodicity).

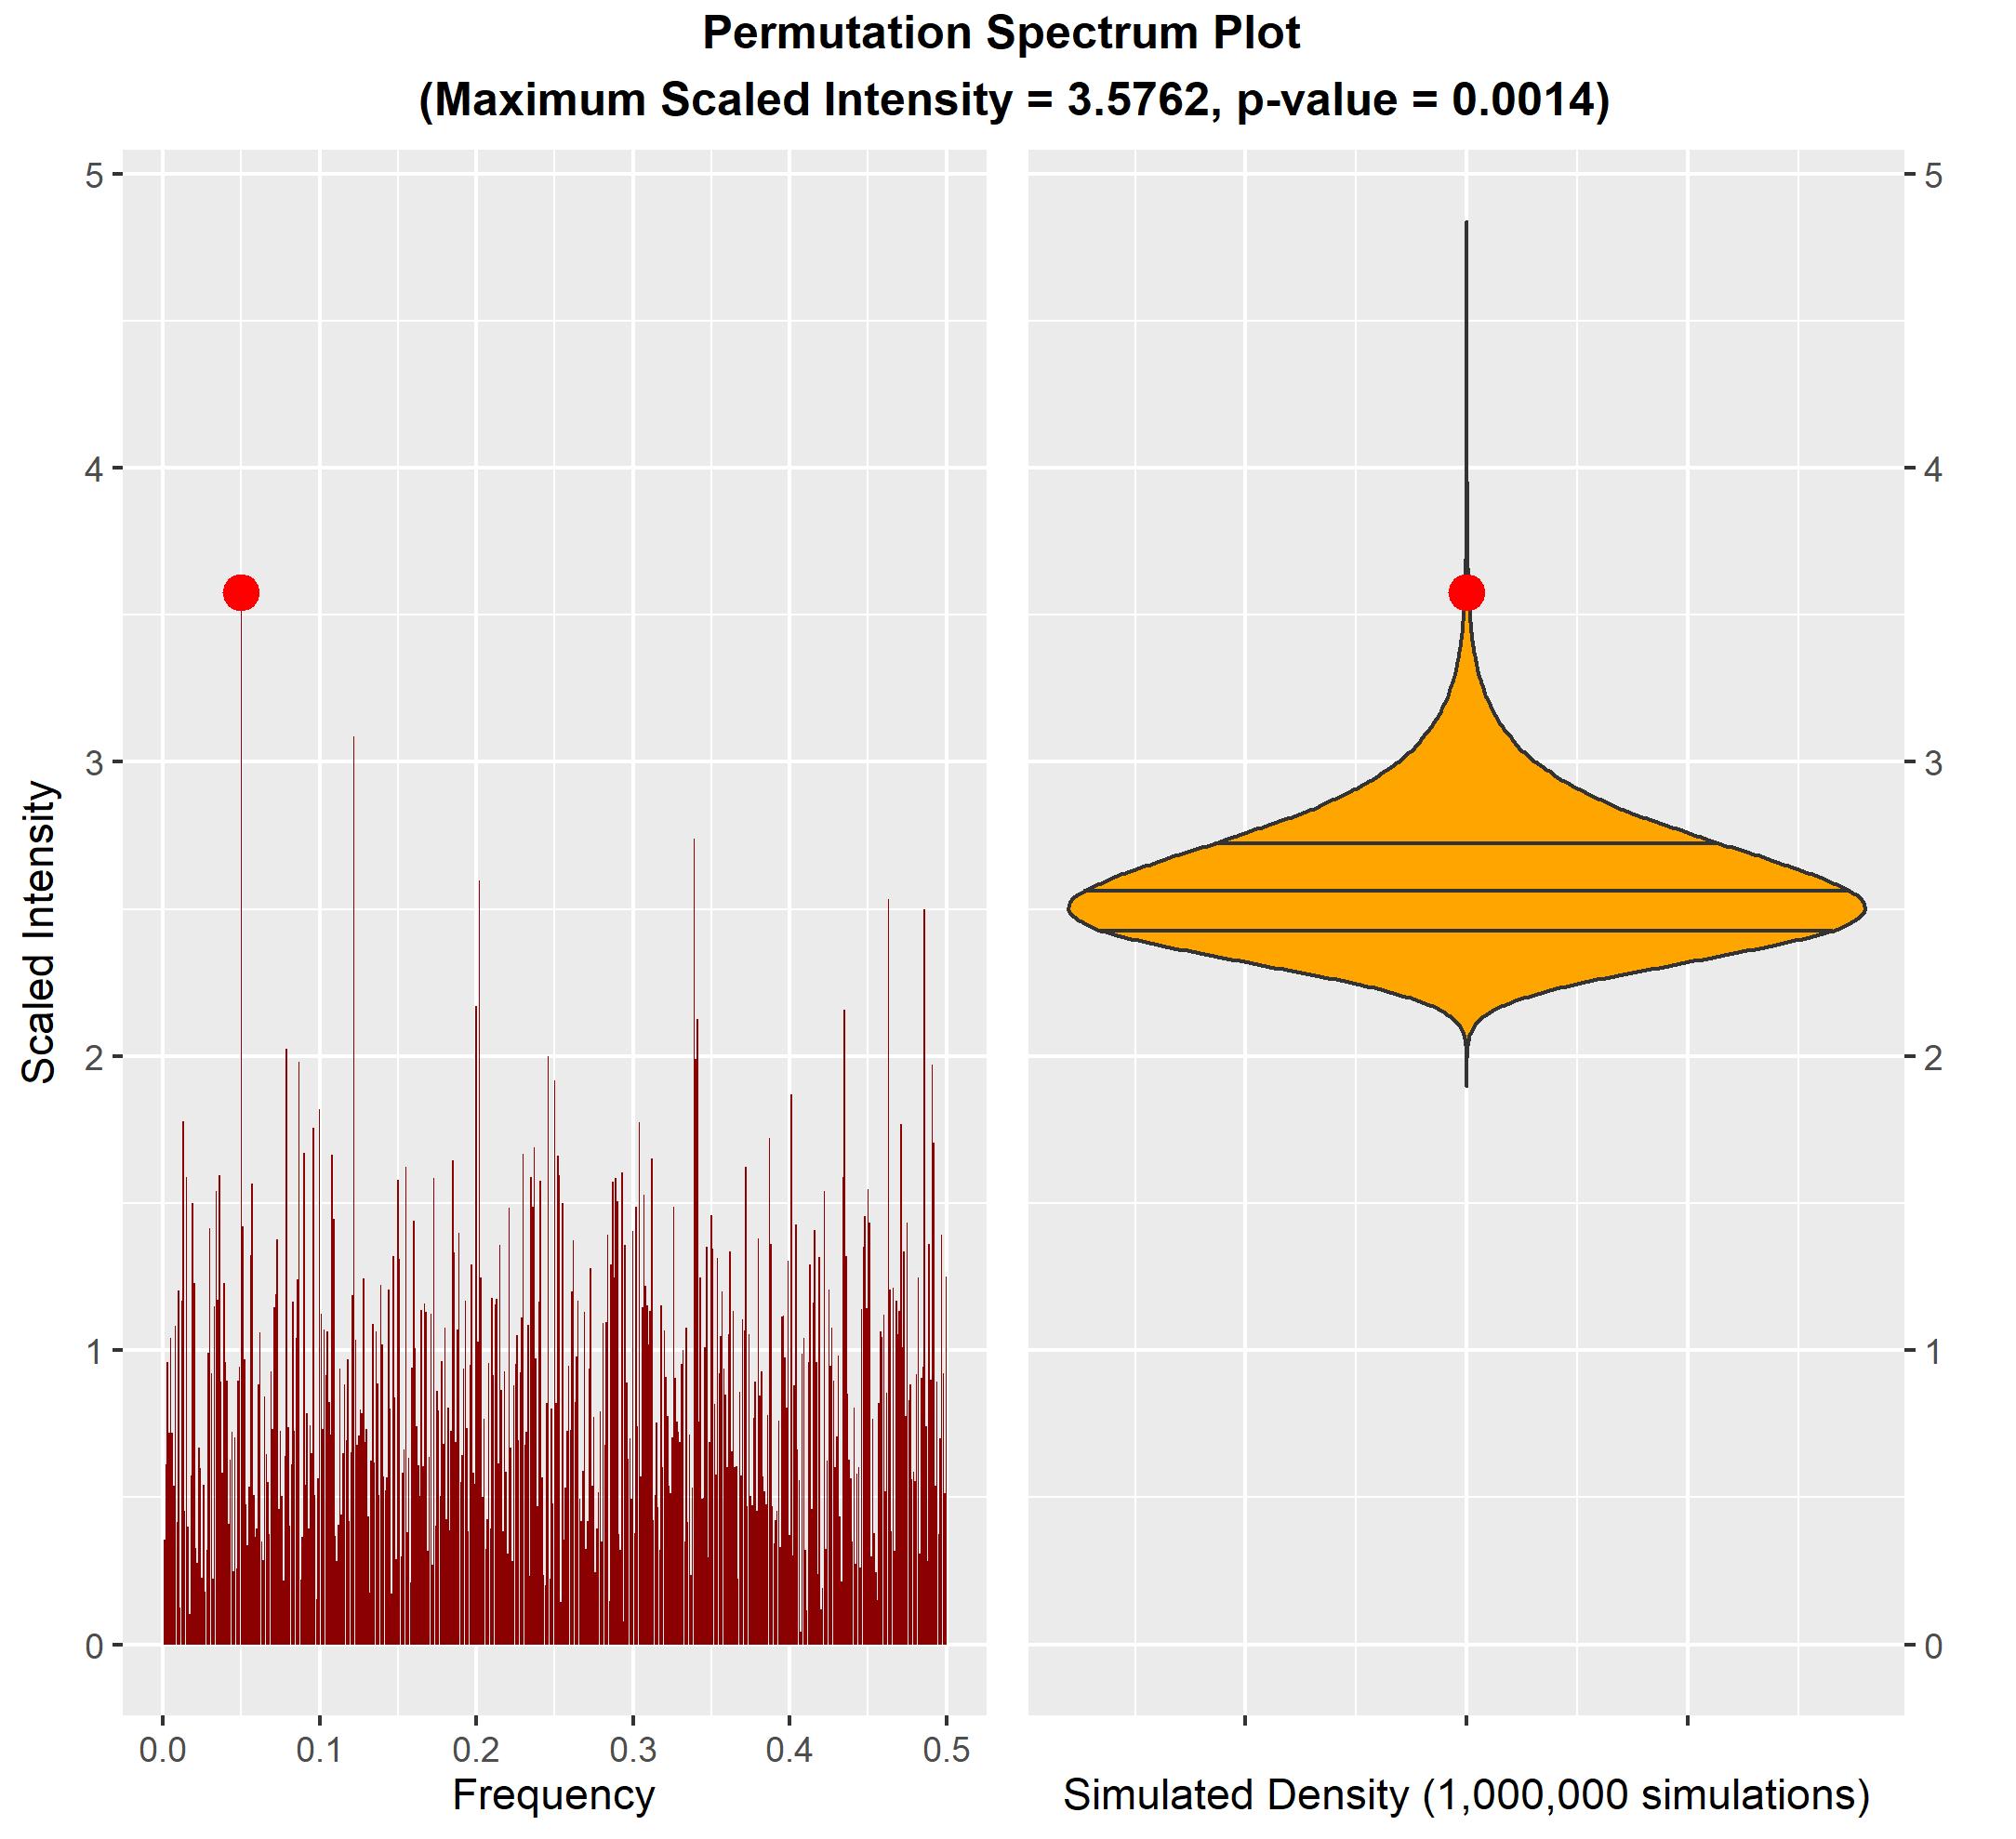
One useful formal test for this purpose is the "permutation spectrum test" which tests the maximum signal intensity against its null distribution under the assumption of exchangeability of the values in the signal (see O'Neill 2020). This particular test does not make any assumption about the marginal distribution of the data, so it is not restricted to testing Gaussian time-series. The null hypothesis for the test is that the time-series values are exchangeable and the alternative hypothesis is that there is at least one periodic signal in the time-series. (It may be useful to remove trends before applying this test.)


Implementation in R: You can use the ts.extend package in R to produce and plot the signal intensity for a time-series or conduct the permutation-spectrum-test. To show you an example of this, let's first produce a time-series with a periodic component.

#Generate periodic part and random part of time-series
set.seed(1)
n <- 1000
A <- rep(1:20, 50)
E <- rgamma(n, shape = 2, scale = 30)

#Generate time-series with periodic part
a <- 1
X <- a*A + E

It is simple to produce and plot the intensity of the series in the frequency domain to see if there are any "spikes" giving evidence of a periodic component.

#Show intensity of time-series
library(ts.extend)
INTENSITY <- intensity(X, scaled = TRUE)
plot(INTENSITY)
enter image description here

We can see that there are some spikes at particular frequencies in the Fourier domain, but are they big enough to falsify the assumption that this is exchangeable noise? To test this we implement the permutation-spectrum test and produce an appropriate plot. In the present case the test correctly identifies strong evidence that there is at least one signal in the data. (The p-value for the test is $p=0.001385$.)

#Implement the permutation-spectrum test
TEST <- spectrum.test(X)
plot(TEST)
TEST

        Permutation-Spectrum Test

data:  real time-series vector X with 1000 values
maximum scaled intensity = 3.5762, p-value = 0.001385
alternative hypothesis: distribution of time-series vector is not exchangeable 
(at least one periodic signal is present)
enter image description here

$\endgroup$
2
  • $\begingroup$ Any (practically-computable) function of random variables with $n$ inputs which is not invariant to the representations of the permutation group $\Sigma_n$ will be a candidate for some sort of permutation test. Test sensitivity and robustness may vary. $\endgroup$
    – Galen
    Commented Feb 14, 2022 at 22:04
  • $\begingroup$ Indeed. You can find some results for power and robustness of this particular test in the linked paper for any interested readers. The permutation-spectrum test shown here has reasonable power for detecting signals even when the data is not normally distributed. Because it is a permutation test it should be quite robust to the distribution of the input data. $\endgroup$
    – Ben
    Commented Feb 15, 2022 at 0:50

Your Answer

By clicking “Post Your Answer”, you agree to our terms of service and acknowledge you have read our privacy policy.

Not the answer you're looking for? Browse other questions tagged or ask your own question.