I am studying experiment design, and I am trying to understand why certain designs have the Expected Mean Squares that they do. Today, I want to ask about a particular design: the 2-Factor Repeated Measures Design.
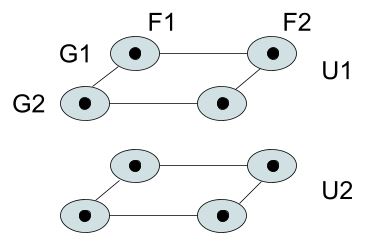
(1) I like to depict the 2-Factor RM design with the following example data structure:
- U = Experiment Units
- F = Factor F with 2 Levels
- G = Factor G with 2 Levels
- Replicates = 1 per (U x F x G) combination
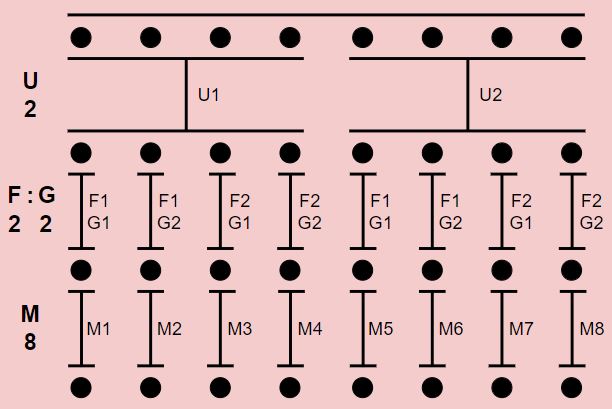
(2) I imagine the randomization scheme to be a two-step randomization, as a 2-Factor CRD inside each Unit. I depict the randomization scheme as a "flow chart" diagram:
(3) I believe the model equation is (via a textbook):
- M = O + U + F + [U:F] + G + [U:G] + F:G + [U:F:G]
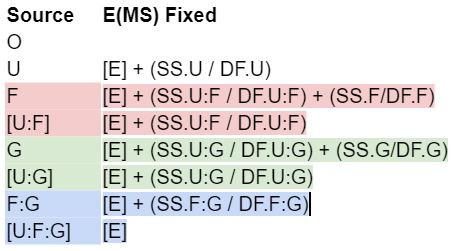
(4) And I believe the Expected Mean Squares is (via a textbook):
(5) QUESTION
- It's obvious what the Expected Mean Squares [E(MS)] are showing, namely that the treatment factor terms F, G, and F:G in the model have E(MS) that are the E(MS) of their corresponding U:F, U:G, and U:F:G terms, plus an additional value specific to themselves. The result is that for an ANOVA analysis, the correct F-test ratios are F/U:F, G/U:G, and F:G/U:F:G.
- My question is how can I calculate these Expected Mean Squares? (A) The structure of the data set is clearly that F, G, and U are all crossed with each other. (B) The only difference between this 2-Factor Rm Design and a 3-Factor CRD Design seems to be the randomization scheme, since this 2-Factor RM Design is randomized like a 2-Factor CRD within the Units. (C) The model equation is even identical to a 3-Factor CRD Design with No Replicates.
- So I am a bit stuck, because I can't figure out how I would calculate the correct E(MS) for this 2-Factor RM Design. Any advice or suggestions are welcome. Thank you! Cheers, Chris


