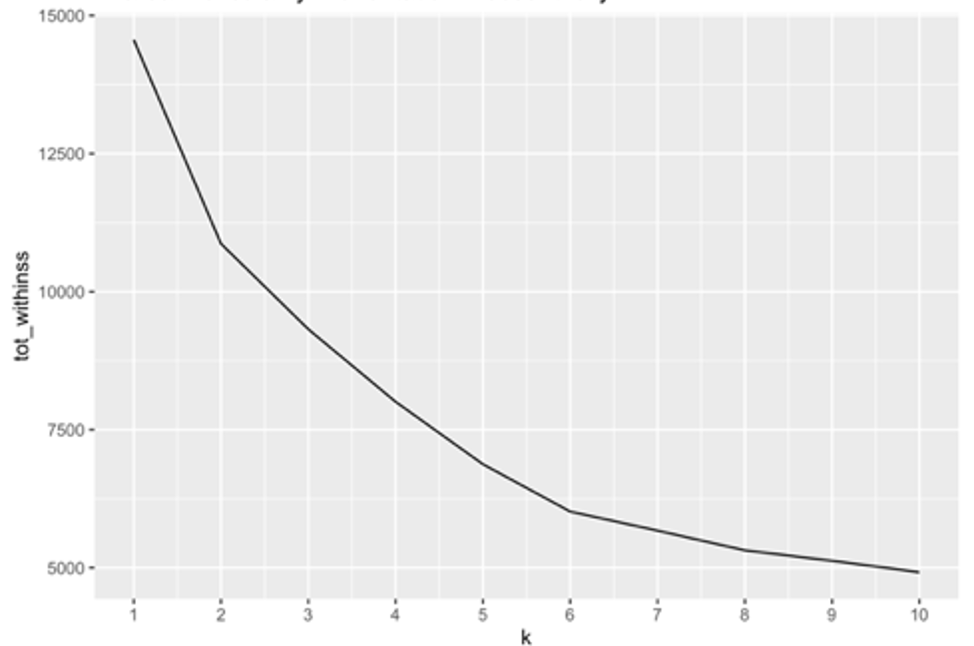
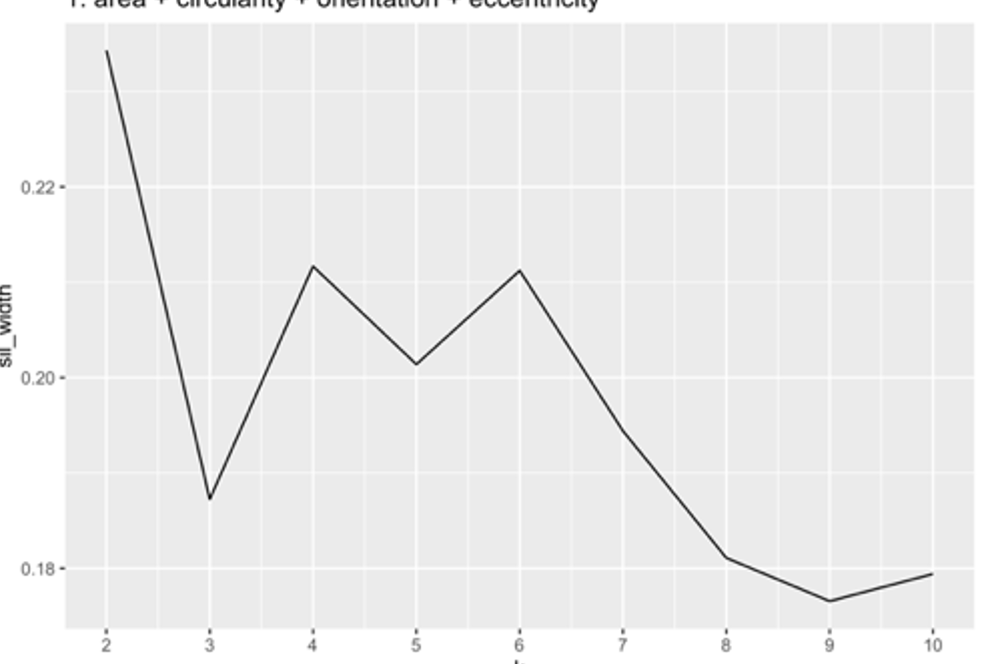
Hi I have this elbow plot that was created to select the K for clustering but I can't find a sound explanation of how to interpret this, all I ever see is a picture of an elbow with in plots with clearly defined flexions. I created the elbow plot and the silhouette plot and my interpretation was that k=2 was the ideal number of clusters based on this two but I not sure if this is the best interpretation

$\begingroup$
$\endgroup$
1
-
$\begingroup$ Please review our related threads. Some of the duplicates (after the first in the list) address your question by showing alternative methods to estimate the number of clusters. Pay attention to preprocessing issues, too, as discussed at stats.stackexchange.com/questions/140711. $\endgroup$– whuber ♦Commented Feb 4, 2022 at 18:07
Add a comment
|

