2
$\begingroup$

Suppose that $Y,Z$ are independent, continuous, non-negative random variables. Suppose also that for some $0<q<1$, $$\tau=\inf\{t>0:F_Y(t)\geqslant q\}$$ and $$\pi = \inf\{t>0:F_{Y+Z}(t)\geqslant q\},$$ where $F_Y$, $F_{Y+Z}$ are the cdfs of $Y$ and $Y+Z$, respectively. Then we have (by continuity) that $$F_Y(\tau)=F_{Y+Z}(\pi)=q.$$

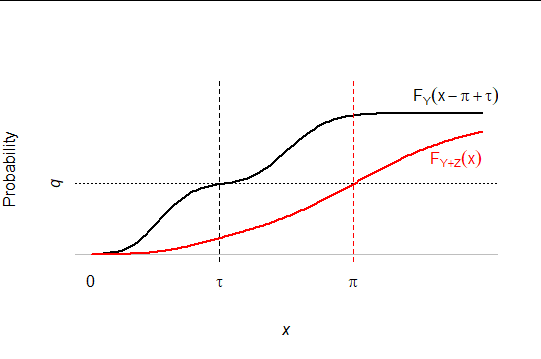
What effect do we get by translating? That is, what can we say about the order of $F_Y(\tau-x)$ vs. $F_{Y+Z}(\pi-x)$ for $0\leqslant x\leqslant \pi$? Of course, both functions will start at $q$ when $x=0$ and both functions will decrease to $0$. The function $F_Y(\tau-x)$ will reach zero no later than $x=\tau$, and $F_{Y+Z}(\pi-x)$ will reach zero no later than $\pi$. My intuition is that $F_{Y+Z}(\pi-x)\geqslant F_Y(\tau-x)$ for all $0\leqslant x\leqslant \pi$. But I can't seem to rule out the possibility that the functions could cross over each other several times for different values of $x$.

I've tried to work several proofs, to no avail. I've plotted a few exact situations, and run a few simulations for those situations in which I could not be bothered to get the exact cdfs. I haven't seen my intuition violated.

$\endgroup$
3
  • $\begingroup$ Let $U_i$ independently have a uniform distribution on $[0,1]$ and let $Y=U_1^{-1/3},$ $Z=U_2^{-1/3}.$ Set $q=0.8.$ If I have computed correctly, the functions cross around $0.43.$ $\endgroup$
    – whuber
    Commented Feb 25, 2022 at 18:24
  • $\begingroup$ Can you show your calculations? I simulated these and the functions do not cross in the plot. $\endgroup$
    – user469053
    Commented Feb 25, 2022 at 18:58
  • $\begingroup$ I'm very sorry--there was a bug in my code. I'll post a better counterexample. $\endgroup$
    – whuber
    Commented Feb 26, 2022 at 13:46

1 Answer 1

3
$\begingroup$

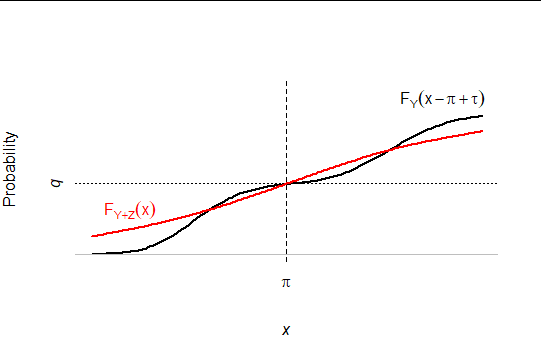
This is an accurate plot of the distribution functions of a positive variable $Y$ and its sum with a uniform$(0,1)$ variable $Z.$

Figure 1

The question proposes shifting one of these graphs until $\tau$ and $\pi$ coincide and investigating their relative positions to the left of that common point. The next figure has shifted the graph of $F_Y$ to the right.

Figure 2

As you can see in this example, it is not the case that one of the graphs is always above the other at the left (or even the right, for that matter).


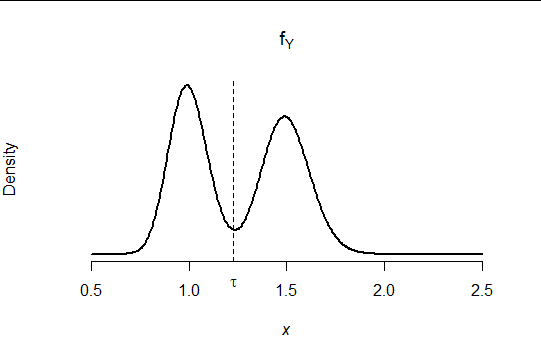
How was such an example constructed? Observe that we can force the black curve, for $F_Y,$ to be as level as we like at its quantile $\tau$ by making sure it has very small density at $\tau,$ because its density is the derivative of $F_Y.$ In this fashion the black curve immediately to the left of this quantile will remain high. However, since $Z$ is a non-negative variable, $F_{Y+Z}$ reflects a "smeared" version of the distribution of $Y$ for values smaller than $\tau.$ By giving $Y$ relatively high density there, we can ensure that the slope of $F_{Y+X}$ at $\pi$ is high. This causes the red curve in the second figure to drop below the black curve as we move left from $\pi.$

In this particular example, the distribution of $Y$ is an equal mixture of a $\Gamma(100,100)$ distribution and a $\Gamma(150, 100)$ distribution (the first parameter is the shape, the second is the inverse scale). (It has been shifted a bit to the left in the first figure.) This mixture is bimodal with a relatively level, low-density region exactly at the median $q=1/2.$

Figure 3


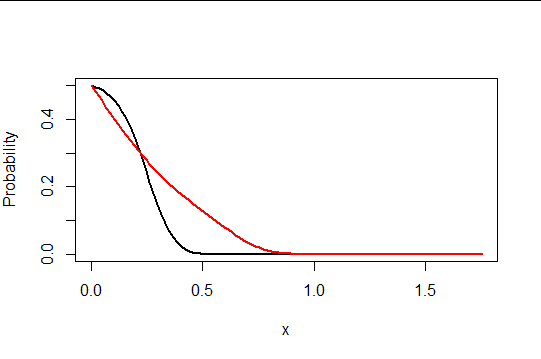
Here is a simulation to check (in R). Its output is below the code: it plots the two functions defined in the question, showing how they cross.

n <- 1e5
q <- 0.5
#
# Sample Y and Z.
#
k <- rbinom(1, n, q)
y <- c(rgamma(n-k, 100, 100), rgamma(k, 150, 100))
z <- runif(n)
# 
# Construct Y+Z.
#
yz <- y + z
#
# Define the functions in the question.
#
tau <- quantile(y, q)
pi. <- quantile(yz, q)
fY <- function(x) ecdf(y)(tau-x)
fYZ <- function(x) ecdf(yz)(pi.-x)
#
# Plot them together to compare.
#
curve(fY(x), xlim=c(0, max(tau, pi.)), lwd=2)
curve(fYZ(x), add=TRUE, col="Red", lwd=2)

Figure 4

$\endgroup$

Your Answer

By clicking “Post Your Answer”, you agree to our terms of service and acknowledge you have read our privacy policy.

Not the answer you're looking for? Browse other questions tagged or ask your own question.