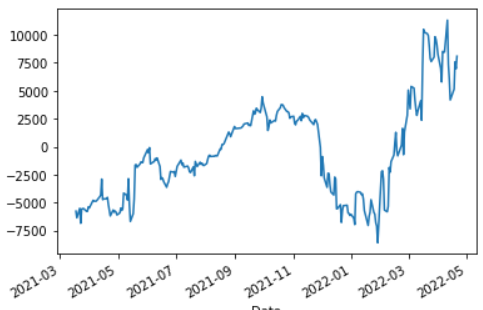
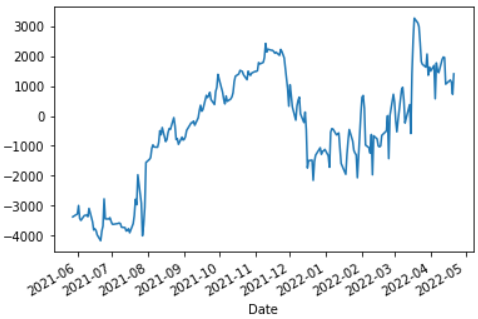
I've been wondering recently about covariance stationarity. Say we have a stationary series with statsmodels' ADF and KPSS results:
ADF:  (-17.69367433194328, 3.562758332968972e-30, 0, 326, {'1%': -3.4505694423906546, '5%': -2.8704469462727795, '10%': -2.5715154495841017}, 4125.109339911818)

KPSS:  (0.27792620704854987, 0.1, 17, {'10%': 0.347, '5%': 0.463, '2.5%': 0.574, '1%': 0.739})
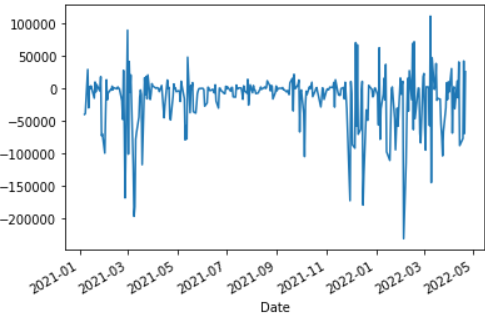
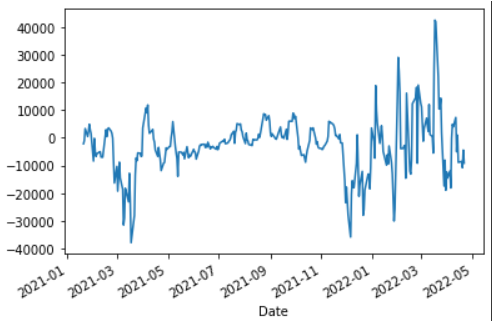
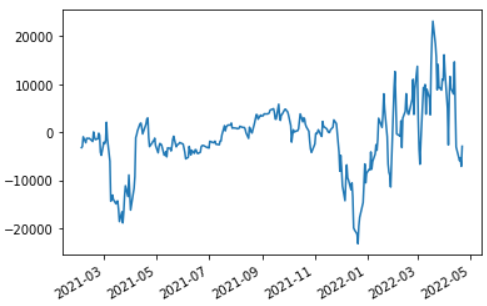
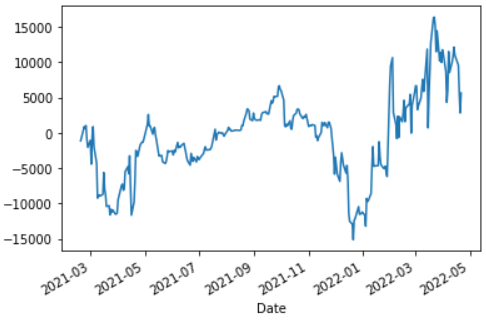
and then let us calculate rolling autocovariance functions for the first lag and more-or-less-random rolling window:
    for i in [2, 10, 20, 30, 50, 100]:
      walk_cov = data.rolling(i).cov()["diff"][:, "lag"].plot()
      plt.show()
this code results in:
You can say I've gone completely crazy, but to me this doesn't look like any of these plots represent stable autocovariance, even though both ADF and KPSS tests said it is. Are the biggest values here simply outliers that were artificially created by big epsilon of the process? And if it isn't, how do models like autoregressive model even hold up?
Am I doing something wrong, or am I missing some piece of information?
PS: I'm NOT using log returns on purpose in this example.


