4
$\begingroup$

My data consists of score values in the range of -400 to 400.

I am thinking of log-transforming them, but is it statistically wise for me to make 400 as a constant?

log(x + 400)

If I have values between 0 and 400.

I know I can do log ( x + 1 ) to log-transform them successfully if I have zeroes in the dataset. Would the values of the constant matter when log-transforming?

Any input is appreciated.

$\endgroup$
1
  • 1
    $\begingroup$ Why log transform in the first place? What's the range of values you could observe? Do you have heavy tails that makes you want to transform data? What's the actual problem / question you try to answer? $\endgroup$ Commented Jul 17, 2022 at 18:56

2 Answers 2

4
$\begingroup$

It matters, sure. I don't know how it applies to your case specifically, but since the log function grows more and more slowly it effectively squeezes values more toward one another with a higher constant.

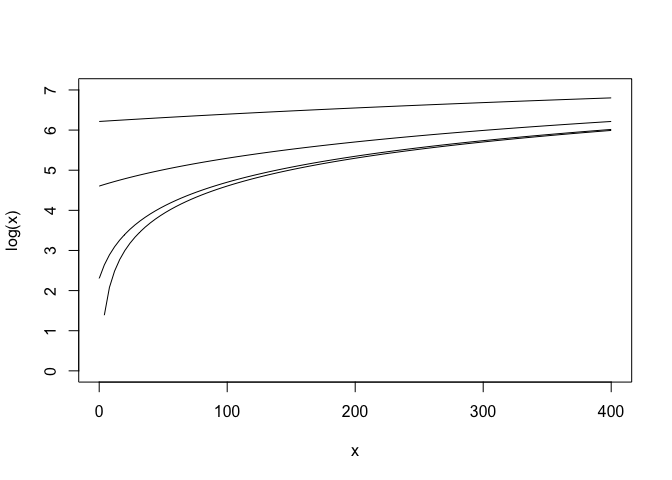
You can for instance make the variance on the log scale very small by using a huge constant, see examples below. The curves in the plot arrange themselves with increasing constant from bottom to top. We see that the log(x+500) curve barely changes over the interval of x.

x = runif(100, 0, 400)

# variance of log(x)
var(log(x))
#> [1] 1.310974

# variance of log(x+400)
var(log(x+400))
#> [1] 0.04018586

curve(log(x), from=0, to=400, ylim=c(0,7))
curve(log(x + 10), add=T)
curve(log(x + 100), add=T)
curve(log(x + 500), add=T)

Created on 2022-07-17 by the reprex package (v2.0.1)

$\endgroup$
2
$\begingroup$

You should do what is meaningful according to your understanding of the data and hypotheses

For instance, if I wanted to empirically check the total radiated energy then it doesn't matter if my temperatures are in [-20, 100) because I'm observing household objects or [15, 1000) (i.e. already positive) because I'm working with molten metals, I should be converting to absolute units.

Similarly, if I'm looking at assessment results for some test I'd think about what it means to be twice as good and whether that's reflected in the data - for instance, can I identify a cohort which I expect to have a (translated) log-normal distribution, and why?

In short, you are choosing a point such that it makes sense to multiply positive distances from this point. This point may not be the same for all your records - if you're assessing sales of foodstuffs item 1 may have twice the price of item 2 but three times the profit margin - which feature is more meaningful (and how do loss leaders fit into your model)?

$\endgroup$

Not the answer you're looking for? Browse other questions tagged or ask your own question.