If the dependent variable is discrete ordinal, like 0-10 then an ordered logit or ordered probit is appropriate to use. They are both similar but their interpretation are different and their error is different distributed. An ordered logit is logistically distributed and an ordered probit is normal distributed. The ordered logit have odds ratio while the ordered probit don't. Which method is used don't make a significance difference.
The above is what I read and understood from different sources. Even though I thought to plot the distribution of my data to see if it follows a logistic or normal distribution.
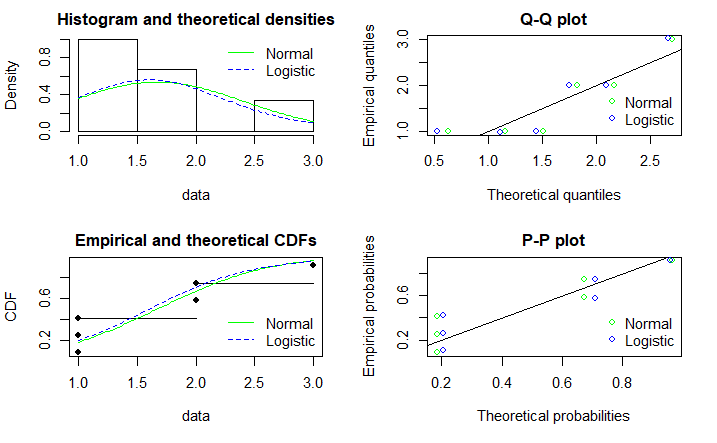
To do this I found that the plots below could be done. My question is then: is this a good way to choose between ordered logit or ordered probit?
library(effects)
library(fitdistrplus)

wvs.data = head(WVS) # data from the effects package
wvs.data
  poverty religion degree country age gender
1       1      yes     no     USA  44   male
2       2      yes     no     USA  40 female
3       1      yes     no     USA  36 female
4       3      yes    yes     USA  25 female
5       1      yes    yes     USA  39   male
6       2      yes     no     USA  80 female

wvs.data$poverty = as.numeric(wvs.data$poverty)

fit1 <- fitdist(wvs.data$poverty, "norm")
fit2 <- fitdist(wvs.data$poverty, "logis")

par(mfrow=c(2,2))
denscomp(list(fit1, fit2),legendtext = c("Normal", "Logistic"),
           fitcol = c("green", "blue"))
qqcomp(list(fit1, fit2),legendtext = c("Normal", "Logistic"),
           fitcol = c("green", "blue"))
cdfcomp(list(fit1, fit2),legendtext = c("Normal", "Logistic"),
           fitcol = c("green", "blue"))
ppcomp(list(fit1, fit2),legendtext = c("Normal", "Logistic"),
           fitcol = c("green", "blue"))
par(mfrow=c(1, 1))
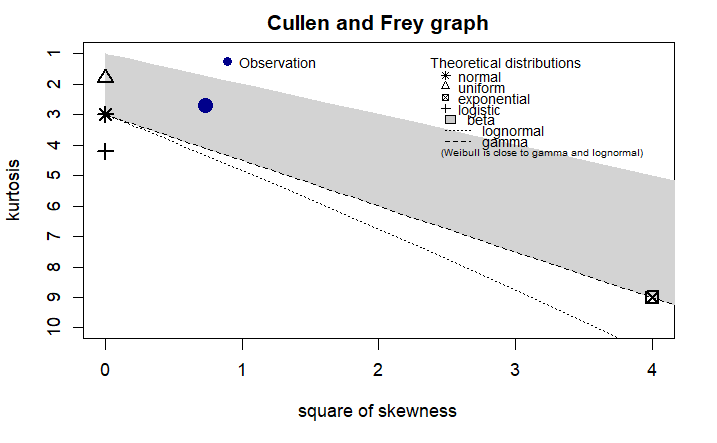
descdist(wvs.data$poverty, discrete = FALSE)
summary statistics
------
min:  1   max:  3
median:  1.5
mean:  1.666667
estimated sd:  0.8164966
estimated skewness:  0.8573214
estimated kurtosis:  2.7


