8
$\begingroup$

I am trying to understand what variance is, I already know the "official" definition "Variance is the average squared deviations from the mean"

But I am trying to give it a visual entity.

I get to this conclusion through this logic.

Given this formula that represent variance :

enter image description here

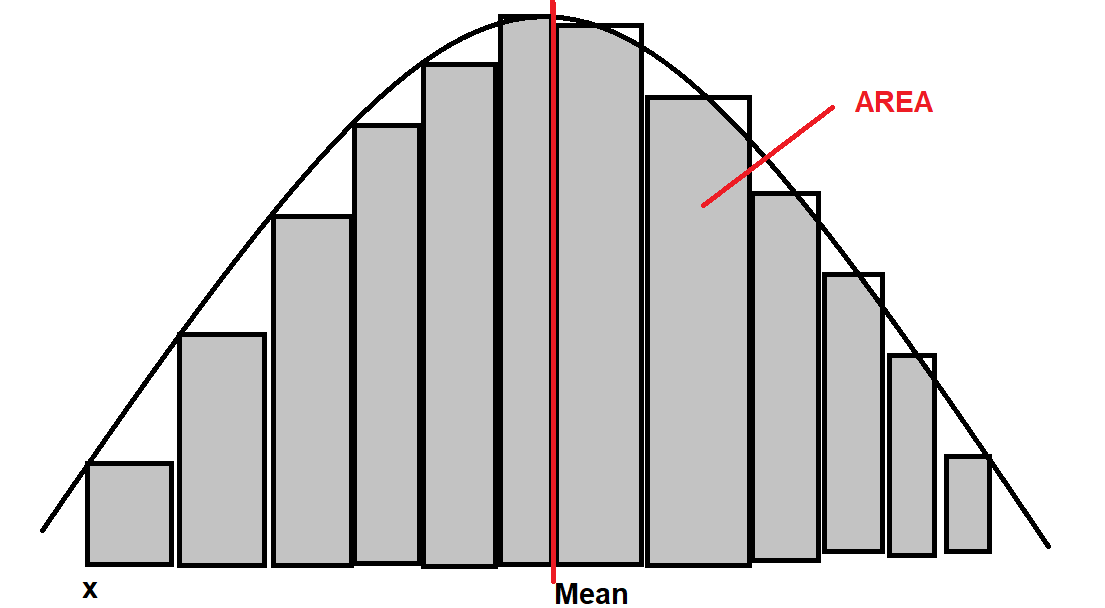
If an Xi is way far from the mean, then it will get a big square but given his little proportion of Pi, it become very tiny square. Otherwise, when an element closer to the mean it will get a little square but the big proportion of Pi, turn it into big square. So in my head it turns into something like this:

enter image description here

Is this idea an approximation to the reality or it his a flagged conclusion?


Based in what you have comment me, and what I have watched in this video that I could look for thanks to you. I've cleared my mind a little more.

https://www.youtube.com/watch?v=ISaVvSO_3Sg

There are some details that I maybe get a little confused and couldn't express myself properly, misusing tags etc

The area of a probability it will always by 1 cause it refers to the total of a proportion that it cat reach to 100% (or 1) right? From what @AdamO have told me in the comments

Let me bring this hypothetical cases to understand a little bit more

Let supposed that, I have a a population of 40 elephants, with the same age, with the exactly same weight, nor even a nanogram lower or higher. If I have to use this formula

enter image description here

It will be no variance since all have the same data right?

Lets suppose now that I have the same set elephants, but now we add 20 more elephants to weight 100 kg less than the original, and another 20 that are 100 kg heavier than the original.

If we keep adding more elephants, with more weight and less weight, keeping the balance and keeping the same mean. It will start change the variance.

I wouldn't know exactly the figure or the shape of the distribution, but I would know, the final size of the combination of all of them. Isn't that somehow, the area of the distribution of the population? The only case that it didn't exist is in the hipotetical case of a stack of elements with all have the same value therefore, stacks of elements that all are the mean

$\endgroup$
3
  • 9
    $\begingroup$ The area under the curve of any probability distribution is 1, that's the zero-th moment. The mean is the first moment, it's essentially the center of mass of a distribution. If a density is shifted so that the mean is 0, the variance is the second moment. You can also conceptualize it as the expected squared deviation. $\endgroup$
    – AdamO
    Commented Dec 5, 2022 at 20:33
  • 6
    $\begingroup$ The variance of a random variable $X$ with distribution $F$ and mean $\mu$ is the second moment of inertia around the vertical axis through $\mu.$ It's also half the mean squared difference between two independent random variables having this distribution. It's also the expectation of $|X-\mu|$ with respect to the distribution with density proportional to $|x-\mu|\mathrm dF(x)$ (that is, a weighted absolute deviation). All these characterizations lead to geometric interpretations. $\endgroup$
    – whuber
    Commented Dec 5, 2022 at 21:52
  • $\begingroup$ See stats.stackexchange.com/questions/84158/… for graphical moments, which can be made for variance also ... $\endgroup$ Commented Dec 11, 2023 at 0:40

2 Answers 2

6
$\begingroup$

The area is the width times the height, but the variance is the width squared times the height. In statistics, we speak of "moments". The n-th moment is the integral of x the n-power times the function. The 0-th moment is $\int x^0 f(x)dx$, or just $\int f(x) dx$. For a PDF, that should be 1 no matter what. The 1st moment is $\int x^1f(x) dx$, which is the mean. The second moment is $\int x^2f(x) dx$, which for a centered distribution, is the variance. You can get a visual by imagining the function rotated about a vertical line that goes through the mean. The volume that results will be proportional to the variance; if you have probability mass far from the mean, then it will rotate through a larger circle and contribute more to the volume.

$\endgroup$
0
14
$\begingroup$

While both the comments are correct, whuber ♦'s articulated it in a more comprehensive sense that can be conjured up as a "visual entity".

Variances are defined for those random variables which are residing in the space $\mathcal L^2$ where $\mathbb EX^2<\infty.$ It is a measure of spreadness.

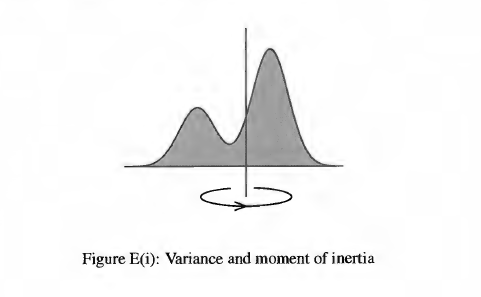
For an intuitive take, the concept of moment of inertia comes handy. $\rm [I]$ expounded it distinctly (emphasis mine):

enter image description here

Variance provides a 'quadratic' measure of how widely the distribution of an RV is spread about its mean. The 'moment of inertia' idea makes this precise. Suppose that $X$ is 'continuous'. Imagine that we make a very thin sheet of metal the shape of the area under the graph of $f_x,$ of unit mass per unit area. The variance of $X$ measures how hard it is to spin this metal sheet about a vertical axis through the mean — see Figure $\rm E(i).$ One precise form of this statement is that if the sheet is spinning, at $1$ complete revolution per second, then its total kinetic energy is a certain constant $(2\pi^2)$ times $\operatorname{Var}(X).$ Experience shows that variance provides a much more useful measure of spread than, for example, $\mathbb E (|X — \mu_X|).$


Reference:

$\rm [I]$ Weighing the Odds: A Course in Probability and Statistics, David Williams, Cambridge University Press, $2001,$ sec. $3.5,$ pp. $67-68.$

$\endgroup$
3
  • $\begingroup$ Thank you very much for your explanation, they are some details that I couldn't fully comprehend, what do you mean with "of unit mass per unit area.". And "through the mean" I could understand the metal sheet spining around a vertical axis but that detail I cant get it. So, we can think variance as olympic hammer throw? That it will measure how much area does it cover? With more variance more area covered and with some of the RV far away from the mean, and with less variance the opposite? $\endgroup$
    – RodParedes
    Commented Dec 6, 2022 at 3:51
  • $\begingroup$ "through the mean" means the vertical stick is passing through the mean value of the distribution. "unit mass per unit area" means the density is unity. Variance measures the spreadness around the mean by measuring how difficult it is to spin the sheet i.e. moment of inertia. $\endgroup$ Commented Dec 6, 2022 at 4:06
  • 1
    $\begingroup$ @RodParedes "of unit mass per unit area" means that we have units such that the amount of mass per area is `1, in our units. So if the unit of mass is m, and the unit of distance is d, each square of area d^2 has mass m. It's just a way of saying "Don't worry about what units we're using, that's not important to my point. Just imagine we have units such that everything's as simple as possible." $\endgroup$ Commented Dec 6, 2022 at 4:55

Your Answer

By clicking “Post Your Answer”, you agree to our terms of service and acknowledge you have read our privacy policy.

Not the answer you're looking for? Browse other questions tagged or ask your own question.