1
$\begingroup$

Assume there are two possible categories, coded as $0$ and $1$.

Define positive predictive value (PPV) to be the probability that an observation really is in category $1$ when it is predicted as being in category $1$. This is distinct from sensitivity or recall, which is the probability of predicting an observation to be in category $1$ when it is in category $1$. That is, if $y$ is the true observation and $\hat y$ is the prediction:

$$ P\left( y = 1\vert \hat y=1 \right)\\ \text{Sensitivity} = P\left( \hat y = 1\vert y=1 \right) $$

To me, it seems like PPV should not care about the test sensitivity. PPV conditions on predicting category $1$. Therefore, no matter how remote the possibility is of predicting category $1$, PPV only takes over once such a prediction has been made.

At the same time, it seems like PPV and sensitivity should have some inverse relationship. If the test is skeptical and unlikely to predict category $1$, then a prediction of category $1$ should be regarded as quite remarkable and worth taking seriously. At the same time, if the test will call pretty much anything category $1$ (but doesn't miss cases, so high sensitivity), then who cares when it flags an observation as being in category $1?$ It does that all the time. That is not a special event, and there is not a particularly high probability that the observation really is in category $1$ just because the predictor makes such a prediction.

Applying Bayes' theorem to the PPV sticks sensitivity in the denominator, but I am wondering if my calculation can be taken further to reveal additional insight (particularly about specificity, which I take to be a measure of skepticism) or even get sensitivity to drop out entirely (which I doubt).

$$ \text{PPV} = P\left( y = 1\vert \hat y=1 \right)=\dfrac{ P\left( \hat y = 1\vert y=1 \right)P(y=1) }{ P(\hat y = 1) }$$$$=\dfrac{ P\left( \hat y = 1\vert y=1 \right)P(y=1) }{ P(\hat y = 1\vert y = 1) + P(\hat y = 1\vert y = 0) } $$

$\endgroup$
3
  • $\begingroup$ PPV depends on specificity (and prevalence aka base rate). $\endgroup$
    – Alexis
    Commented Feb 6, 2023 at 2:50
  • $\begingroup$ @Alexis I agree that specificity should factor into the equation somehow. Did I do the calculation wrong? It looks right so far, even if it can go further. (Something about conditioning on $y=0$ in the denominator should lead to specificity, right?) $\endgroup$
    – Dave
    Commented Feb 6, 2023 at 3:05
  • $\begingroup$ The formulae are on Wikipedia in the first chapter "Definition": en.wikipedia.org/wiki/Positive_and_negative_predictive_values. Clearly, sensitivity determines (combined with prevalence) the proportion of true positives. Therefore, it must be involved in the calculation of the positive predictive value. $\endgroup$
    – LuckyPal
    Commented Feb 6, 2023 at 8:05

2 Answers 2

3
$\begingroup$

There is an error in your formula. The denominator should be $$P(\hat{y}=1|y=1)P(y=1) + P(\hat{y}=1|y=0)P(y=0)$$ What you have in the denominator is Sensitivity + (1 - Specificity), which is incorrect.

PPV can be problematic because it depends on the pre-test probability $P(y=1)$ as well as the sensitivity and specificity of the test. Perfectly Specific tests when Positive rule In "disease" (i.e., $y=1$). There's a mnemonic for this: SpPIn. It goes along with SnNOut, which stands for perfectly Sensitive tests when Negative rule Out "disease".

Sensitivity and specificity tend to be local, stable characteristics of a test. They are less dependent on other factors besides $y=1$ vs. $y=0$, which is why they (and not positive and negative predictive value) are the “atomic” relationships in diagnostic reasoning.

For example, assume that you sample cases with $y=1$ separately from an equal number of controls with $y = 0$. You can estimate sensitivity and specificity, then use these estimates along with a different $P(y=1)$ (other than 0.5) to get PPV and NPV. If you try to estimate PPV from that same case-control design, you are assuming that wherever you apply the test, $P(y=1) = P(y=0) = 0.5$.

It is sometimes easier to think in terms of the odds form of Bayes's Rule:

\begin{align*} P(y=1|\hat{y}=1)P(\hat{y}=1) &= P(\hat{y}=1|y=1)P(y=1) \\ P(y=0|\hat{y}=1)P(\hat{y}=1) &= P(\hat{y}=1|y=0)P(y=0) \\ \frac{P(y=1|\hat{y}=1)}{P(y=0|\hat{y}=1)} &= \frac{P(\hat{y}=1|y=1)}{P(\hat{y}=1|y=0)}\frac{P(y=1)}{P(y=0} \\ Odds(y |\hat{y}=1) &= LR(\hat{y}=1)Odds(y)\\ \end{align*}

Pre-test odds = $Odds(y) = \frac{P(y=1)}{P(y=0)}$

Post-test odds = $Odds(y|\hat{y}=1) = \frac{P(y=1|\hat{y}=1)}{P(y=0 | \hat{y}=1)}$

Likelihood ratio for $\hat{y} = r$ is $\frac{P(\hat{y}=r|y=1)}{P(\hat{y}=r|y=0}$

$$\text{Post-test Odds} = \text{Likelihood ratio}(r) \times \text{Pre-test Odds}$$

What we think now = New Information combined with What we thought before.

$\endgroup$
0
$\begingroup$

As is pointed out in another answer, my Bayes' theorem calculation indeed contains a mistake. The correct calculation is below.

$$ \text{PPV} = P\left( y = 1\vert \hat y=1 \right)=\dfrac{ P\left( \hat y = 1\vert y=1 \right)P(y=1) }{ P(\hat y = 1) }$$$$=\dfrac{ P\left( \hat y = 1\vert y=1 \right)P(y=1) }{ P(\hat{y}=1|y=1)P(y=1) + P(\hat{y}=1|y=0)P(y=0) }$$$$ =\dfrac{ \text{sensitivity}\times\text{prevalence} }{ \text{sensitivity}\times\text{prevalence} + \left[ \left( 1 - \text{specificity} \right)\times\left( 1 - \text{prevalence} \right) \right] } $$

From the equation, it is evident that sensitivity does affect the positive predictive value. Holding all else equal, increasing the sensitivity increases the PPV.

The trouble is that sensitivity and specificity need not be independent. In the extreme case, we can get perfect sensitivity by sacrificing specificity. In this case, however, the PPV is just the prevelence. That is, the probability that the case really is a positive, given that it is predicted as positive, is just the prior probability of being positive, and the model has learned nothing.

$$ \text{sensitivity} = 1$$$$ \text{specificity} = 0$$$$ \dfrac{ \text{sensitivity}\times\text{prevalence} }{ \text{sensitivity}\times\text{prevalence} + \left[ \left( 1 - \text{specificity} \right)\times\left( 1 - \text{prevalence} \right) \right] } = \dfrac{ \text{prevalence} }{ \text{prevalence} + \left( 1 - \text{prevalence} \right) } = \text{prevalence} $$

(This calculation also reveals that, if we have zero specificity but do not achieve perfect sensitivity then the PPV is even lower than the prevelence, which means the model is doing worse than learning nothing.)

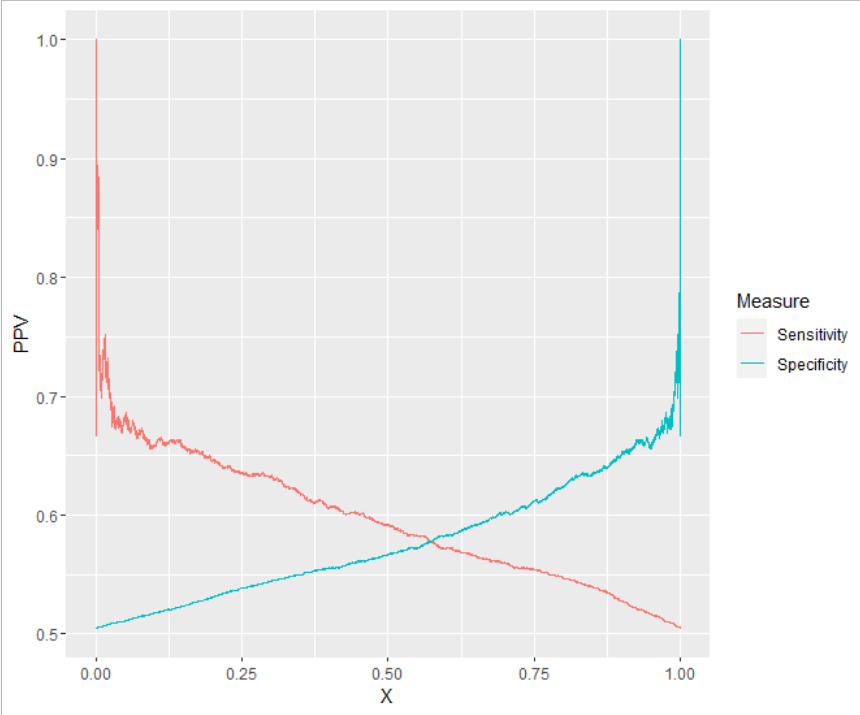
Looking at a simulation, the interplay between sensitivity, specificity, and PPV jumps out.

library(pROC)
library(ggplot2)
set.seed(2023)
N <- 10000
p <- rbeta(N, 14, 14)
y <- rbinom(N, 1, p)
r <- pROC::roc(y, p)
plot(r, main = paste("AUC =", round(r$auc, 2)))
ppv_calculator <- function(sens, spec, prev){
  return(
    (sens * prev)
    /
    (sens * prev + (1 - spec) * (1 - prev))
  )
}
prev <- mean(y)
ppv <- sens <- spec <- rep(NA, N)
for (i in 1:N){
  sens[i] <- sens_now <- r$sensitivities[i]
  spec[i] <- spec_now <- r$specificities[i]
  ppv[i] <- ppv_calculator(sens_now, spec_now, prev)
  
}
d0 <- data.frame(
    X = sens,
    PPV = ppv,
    Measure = "Sensitivity"
)
d1 <- data.frame(
    X = spec,
    PPV = ppv,
    Measure = "Specificity"
)
d <- rbind(d0, d1)
ggplot(d, aes(x = X, y = PPV, col = Measure)) +
    geom_line()

enter image description here

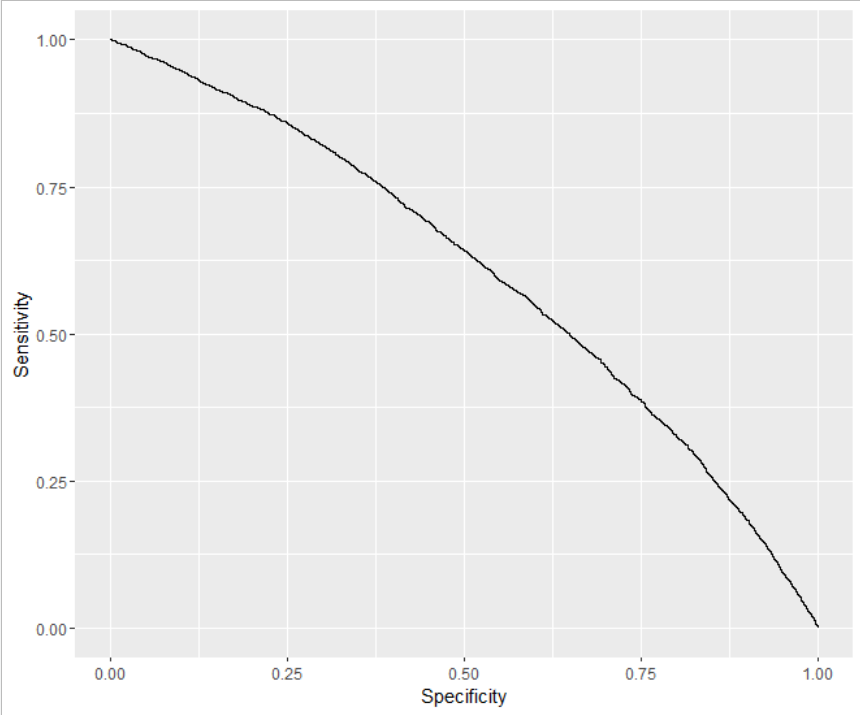
Yes, holding all else equal, improving sensitivity improves PPV. However, improving sensitivity at the expense of specificity, which is the only way to improve sensitivity in this simulation, degrades the PPV, as sensitivity and specificity are related.

sens_spec <- data.frame(
  Sensitivity = r$sensitivities,
  Specificity = r$specificities
)
ggplot(sens_spec, aes(x = Specificity, y = Sensitivity)) +
  geom_line()

enter image description here

Yes, holding all else equal, improving sensitivity improves PPV. However, improving sensitivity at the expense of specificity degrades the PPV. At the same time, as long as there is some sensitivity (ability to detect a positive case), improving specificity without lowering sensitivity increases the PPV; in the extreme, perfect specificity with nonzero sensitivity results in perfect PPV. In other words, as long as there is some ability to detect a positive case, a skeptical model should be taken seriously if it does flag a case as positive.

I find it intuitive that a skeptic making a claim about which she normally is skeptical should be taken seriously. A specific model should not give many false alarms. Therefore, when it does alarm, it is likely to be correct---regardless of how likely it is to give alarms (unless that probability is zero).

$\endgroup$
3
  • $\begingroup$ The "roc" in your R routine stands for "Receiver Operating Characteristic" curve. The ROC curve shows the trade-off between sensitivity and specificity. ROC curves usually put (1-Specificity) rather than Specificity on the X axis. As you relax the threshold for calling the test positive, sensitivity increases at the expense of increased false positive proportion (decreased specificity). $\endgroup$
    – Mkanders
    Commented Feb 6, 2023 at 18:38
  • $\begingroup$ @Mkanders That last sentence is the important point: yes, all else equal, increasing sensitivity increases PPV, but you have to be careful not to increase sensitivity at the expense of specificity, or the increased sensitivity might result in lower PPV, since not all else is equal if the specificity also changes. $\endgroup$
    – Dave
    Commented Feb 23, 2023 at 18:23
  • $\begingroup$ If you have a continuous test result x that is generally higher for y=1 than y = 0, you can choose a cutoff x* and say x > x* is a positive test result, t=1. There is a point on the ROC curve corresponding to x* such that sens = P(x > x*|y=1) and spec = P(x <= x*|y = 0). The slope of the ROC curve at that point is p(x*|y=1)/p(x*|y=0) = LR(x*) (the likelihood ratio). The optimal value of x* depends on the pre-test probability P(y=1) and relative misclassification costs, normally written as C/B. Choose x* so that P(y=1)/P(y=0) * LR(x*) = C/B. $\endgroup$
    – Mkanders
    Commented Aug 28 at 17:04

Your Answer

By clicking “Post Your Answer”, you agree to our terms of service and acknowledge you have read our privacy policy.

Not the answer you're looking for? Browse other questions tagged or ask your own question.