0
$\begingroup$

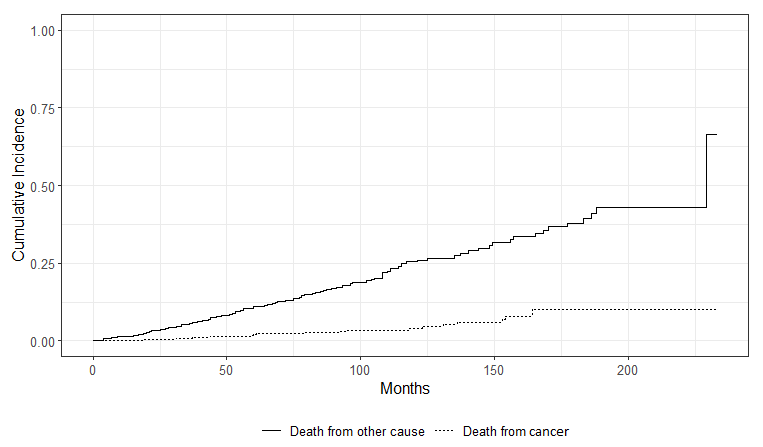
I have a dataset of about 1000 patients with cancer and I was interested at looking at competing events. I plotted out the cumulative incidence curves for deaths from cancer and deaths from other causes

enter image description here

The curves subjectively look very different, but I was wondering is there a statistical test that I could use to compare these curves? I've looked into Fine and Gray models as well as cause-specific hazard models, but seemingly those focus on evaluating the impact of specific covariates on the outcomes.

I've been using the tidycmprsk package as well as the ggsurvfit package in R. My code for the above curves is below

cuminc(Surv(TTOS, status_cr) ~ 1, data = data) %>%
  ggcuminc(outcome = c("Death from other cause", 
                       "Death from cancer")) +
  ylim(c(0, 1)) + 
  labs(x = "Months") +
  add_risktable()
$\endgroup$
2
  • $\begingroup$ Bootstraped confidence intervals on the differences (because analytic CIs are difficult for statistics which are products of conditional estimates, which the cumulative incidence—in the sense of $1 - \widehat{S}(t)$—is an example of). $\endgroup$
    – Alexis
    Commented Feb 26, 2023 at 5:10
  • 1
    $\begingroup$ I have some thoughts on this problem here. There's a problem in that the two cumulative incidence curves under competing risks aren't independent: a change in one necessarily means there is a change in the other. Bootstrapping, as @Alexis suggests, might be used if you have an appropriate statistic describing the differences between the curves, but I haven't thought that through carefully. $\endgroup$
    – EdM
    Commented Feb 26, 2023 at 18:22

0

Your Answer

By clicking “Post Your Answer”, you agree to our terms of service and acknowledge you have read our privacy policy.

Browse other questions tagged or ask your own question.