Main question:
I have an imbalanced binary labeled dataset (6% positive labels) and two different methods of training a predictive model for binary classification (e.g. Tree Model vs. Neural Network), let's call them method/model A and B in this post. I am interested in comparing the performance of these models measured in AUC (AUC-ROC and AUC-PR). I want to make a solid comparison and show that the difference is significant (or not) when I say for example that model A has a better AUC than model B, and not just report a simple difference after one training cycle, as one could then not know if the difference could be attributed to random elements (caused by the random data split).
I have come across multiple options, and am not sure how to implement them or how I can combine them. I will list some concepts I have found, and make a suggestion of how to test the performance difference of which I am not sure whether it is unnecessarily complicated or even valid.
Cross Validation (CV)
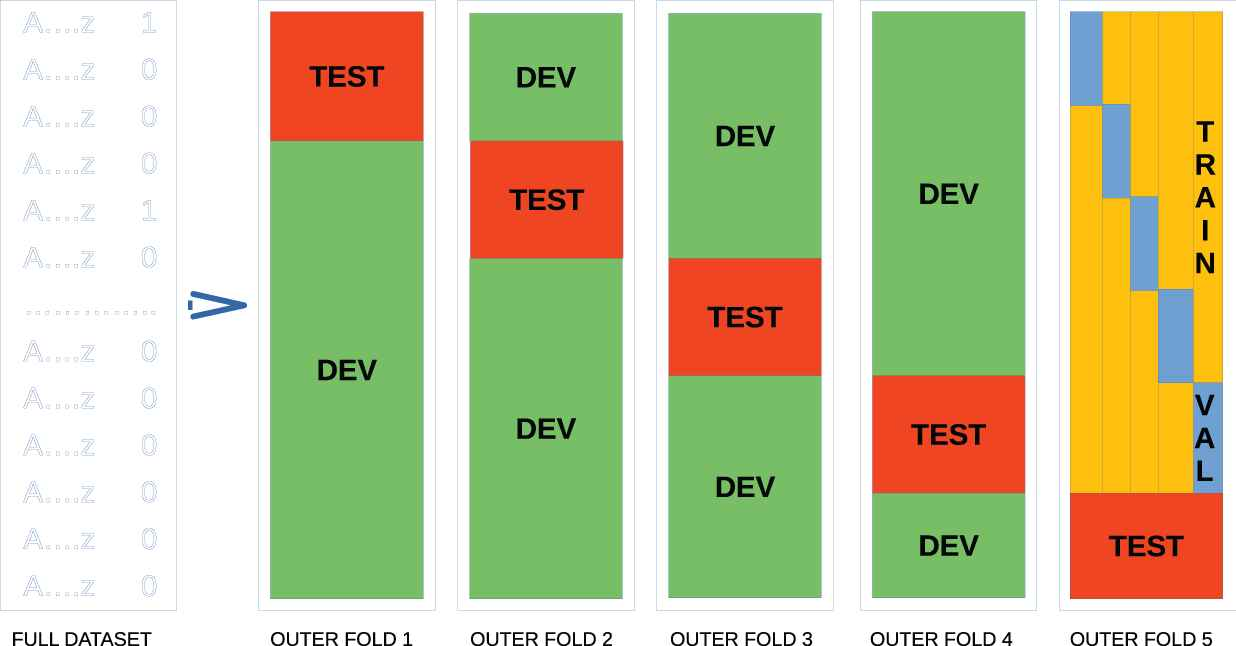
As far as I know, CV is used for two reasons: to get a better understanding of the (out of sample) performance (generalizability) of a model, the error estimation, and second to find the best hyperparameters. When it is used for both at the same time, nested cross-validation (NCV) is required. See the Wikipedia Page on this topic. They distinguish between two variants, but I believe that the cases that they describe come down to exactly the same. The idea is for this k*l-fold cross-validation is as follows. We have an outer loop of let's say five iterations. Within each iteration we split the dataset into a development (dev) set and a test set. Within each iteration we perform another loop of let's say five iterations, where we split the dev set into five different folds of training + validation set. This give in total 25 iterations, where each iteration has a unique fold of train/test/val split. Please see the image below for an overview. The last iteration of the outer loop also shows the inner loop consisting of five iterations as well. Image taken from this paper.
There are two options of testing and calculating a metric within each outer fold:
- We can use the five folds over the dev set (inner loop iterations) to find the optimal hyper parameters, and once found, retrain once on the entire dev set (so train + val instead of just train) and report the performance once applied on the test set. This will produce one metric (let's say AUC) per out iteration, so will give 5 AUCs in total after the entire NCV.
- Each inner iteration, we use the train set to train, using the dev set to find the right hyperparameters and stopping criterion, and then immediately apply the trained model (on only the train set) on the test set. This will produce one AUC per inner iteration, so 25 AUCs in total. Note that even within each outer iteration, the 5 AUCs might be based on different hyperparameters, so it is hard to report what the best hyperparameters are.
I believe I have to go for the second option, because when using my Neural Network I will have to use the dev set not only for the hyperparameters, but also as an early stopping indicator to prevent overfitting. I would not know how to stop the training using only a train and a test set, because the loss on the train set will only go down, and we can of course not look at the performance on the test set prematurely as this would leak information and give a biased indication of the out of sample performance. Applying this second option will then give me 25 AUCs. I was wondering whether I can check for the pairwise difference in AUCs between technique A and B (each pair will have trained and tested on the same data, so I believe I can compare them). I could then maybe take the mean of these 25 differences (let's call them deltas), and calculate the standard deviation of these 25 means (to be used as error bars), and see whether a difference of zero falls within this range of +/- 1 std.
Bootstrapping
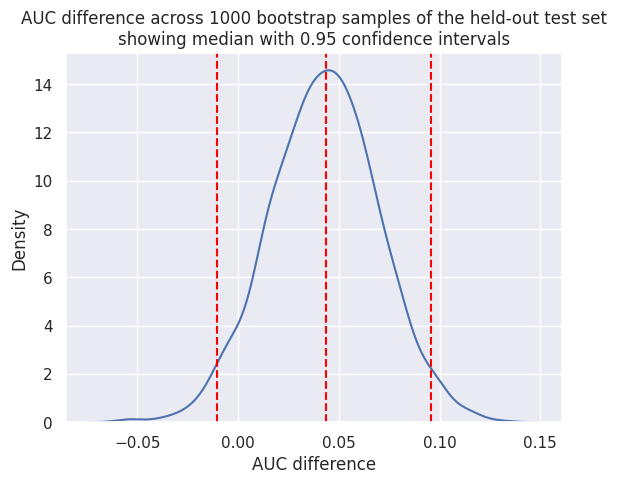
I came across the option of bootstrapping the test set to get confidence intervals. One method, the percentile method, looks at the middle 95% percent of calculated metrics on resampled test sets. One could then take for example 1000 resampled test sets, calculate for method A and B the AUC, get the pair-wise difference, and see whether the 0 difference falls within this middle 95%:

Other options
- Paper by DeLong about comparing ROC-curves, with >18000 citations on Google Scholar.
- Use Paired Permutation test.
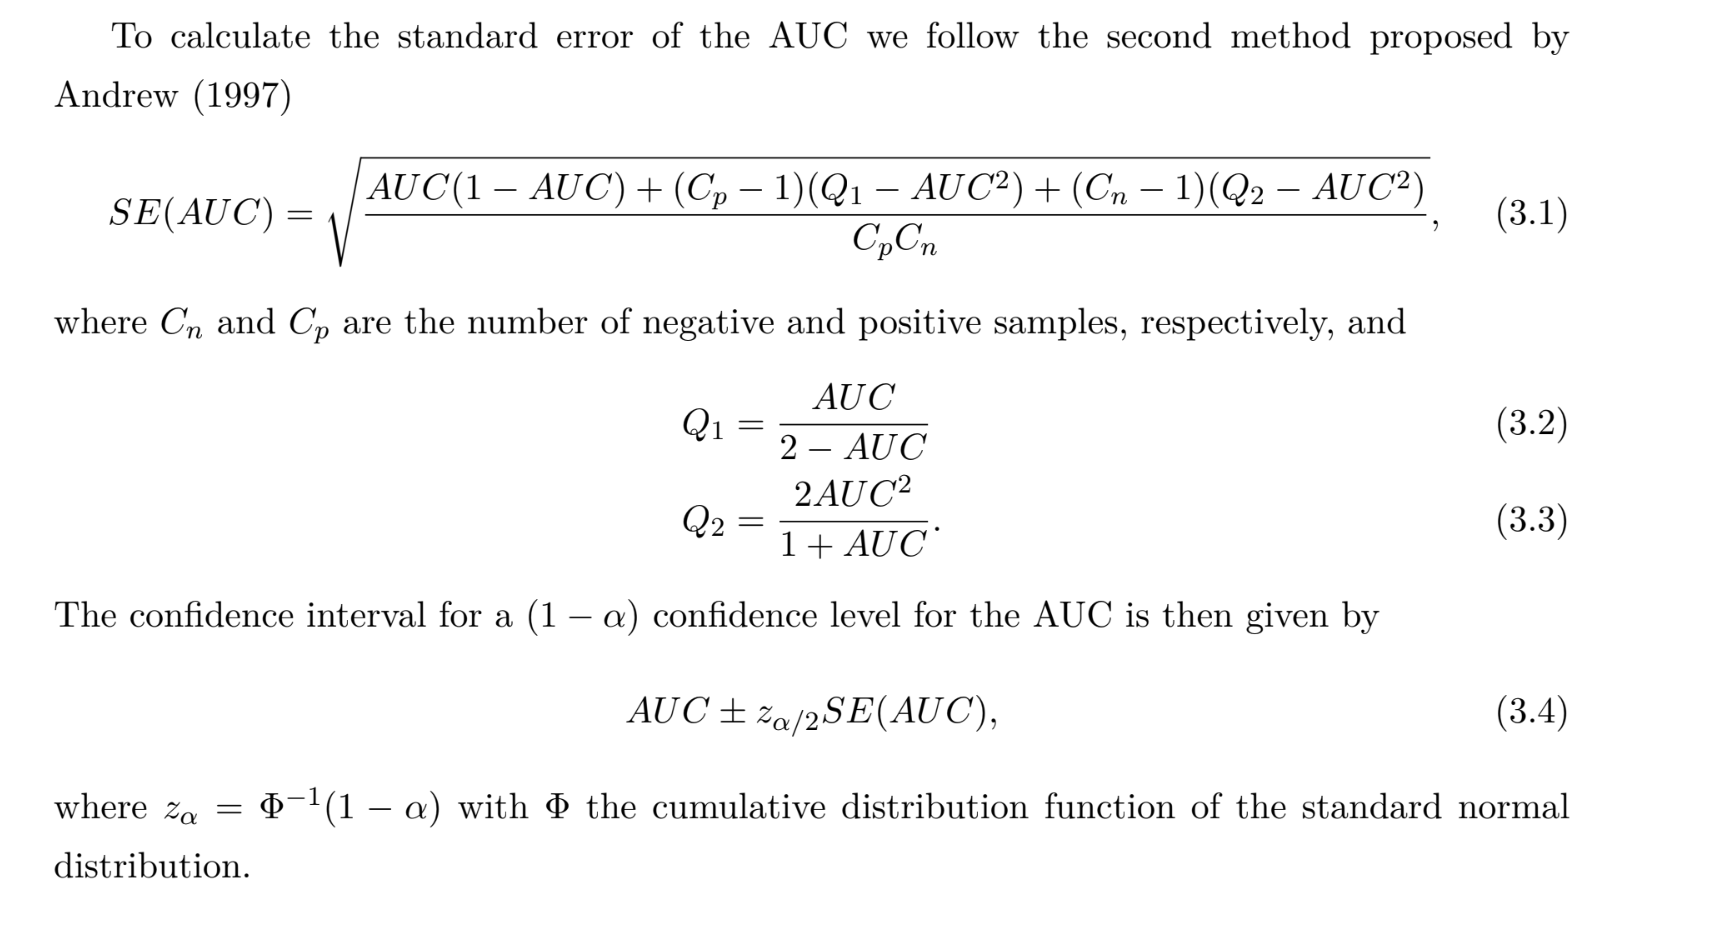
- Use the standard error of the Wilcoxon statistic, a method mentioned in a paper by Andrew (1997) with >7000 citations on Scholar. It comes down to:

Suggestion and questions
For a good balance between simplicity and robustness, I suggest using the second option of the nested cross validation. I will then obtain 25 AUC differences. A question I have then is:
- Once I have these 25 AUC differences, is it correct that I need to take +/- 2*std (1.96 to be exact) and check whether the value 0 falls in this range, to conclude whether there is a significant difference? Sometimes you see error bars in plots that are +/- 1 std only, while I have read that for the 95% confidence interval, you need to do +/- 2 standard deviations.
- Would combining this option with the bootstrapping add anything? I would then obtain 25000 AUC differences, and could check for the middle 95% like I showed in the bootstrapping picture.
- What about the other options I mentioned?
I got kind of lost in all the options. I hope someone can clear this up for me, and let me know if the plan I have makes sense and is valid. Thanks!

