1
$\begingroup$

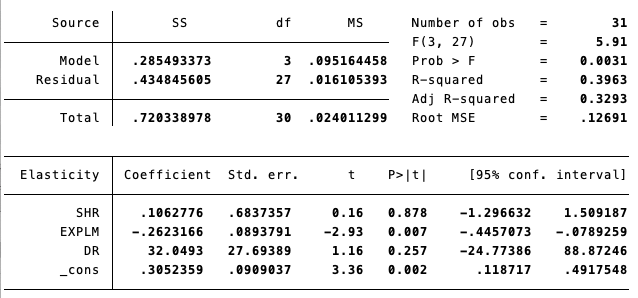
Here're the results of a multi-variable regression analysis run by Stata to test the effects of the three factors on the price elasticity of supply, which is the dependent variable. The coefficients appear to be realistic and the "Prob>F" value seems acceptable. As this is an interdisplinary study and I don't have a solid statistical background, I would like to confirm whether this result can be considered as robust or if there're any obvious warnings that I may have missed.

If you require further context, please let me know, and I can provide additional information.

statistical results

Edit: So I read in another thread that this could be due to the possibility that DR and SHR alone are not correlated, but they are when controlled by other factors. So I ran another regression dropping SHR just to test this; then I get the result as follows:
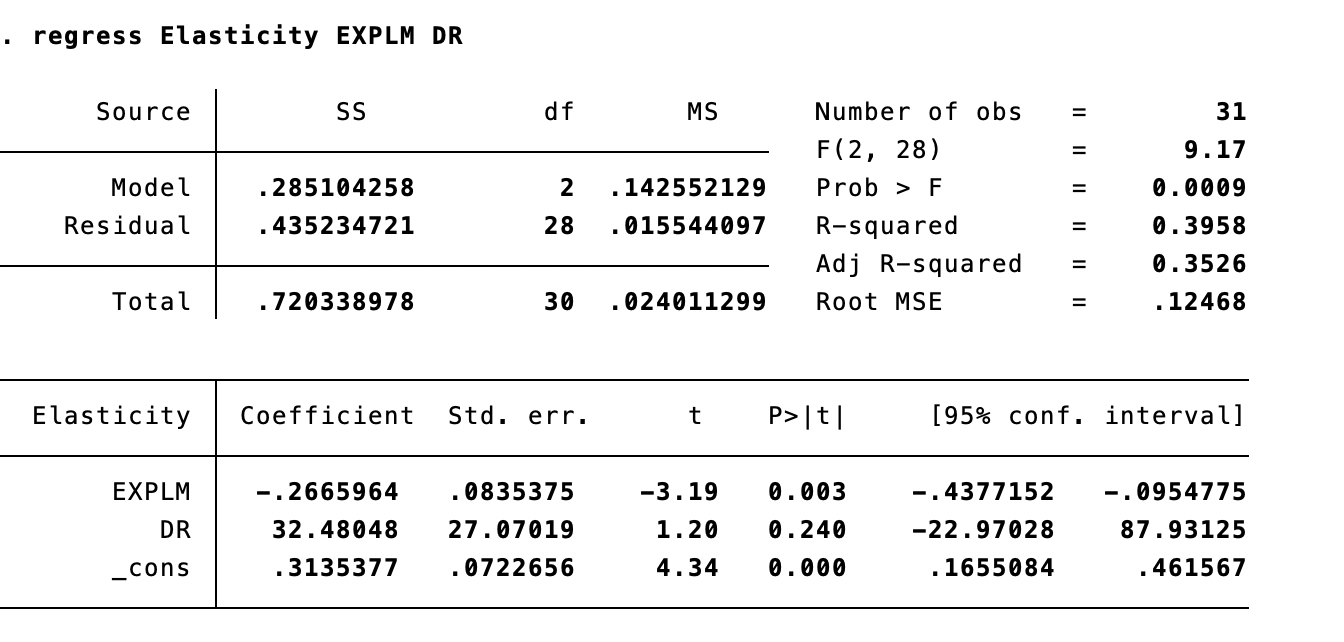
Regression dropping SHR You see here the F-test shows an even lower value, but the P-value for variable DR is still very high. What could be the explanation for it?

$\endgroup$

1 Answer 1

0
$\begingroup$

Two of your explanatory variables, SHR and DR, show too high standard errors (with respect to their estimated coefficients) yet you reject the null hypothesis. This may be a sign of multicollinearity. Are these variables defined through each other, e.g. is one of them a linear combination of the other?

I suggest you compute the correlation matrix of your variables and check if these variables show high correlation. This is okay if your intention is to do prediction (see Gujarati's Basic Econometrics) but in this state you cannot proceed with statistical inference as two of your estimations are highly imprecise.

You can drop variables based on the correlation matrix, or based on your theorization. I would proceed with the latter before the former, as if your model shows signs of multicollinearity, this can be a consequence of sampling (https://online.stat.psu.edu/stat462/node/177/).

$\endgroup$
2
  • 1
    $\begingroup$ What is a "too high standard error" and why might it indicate collinearity? One would suspect SHR and DR have little association with the response, that's all. Please check out the threads at stats.stackexchange.com/questions/3549 and stats.stackexchange.com/questions/24720. Generally it's not a great idea to drop variables by inspecting the correlation matrix for high absolute correlations. That's a subtle topic covered in various threads on model building and regression diagnostics you can find here on CV. $\endgroup$
    – whuber
    Commented May 13, 2023 at 23:37
  • 1
    $\begingroup$ Thank you for the answers. However, it is improbable that multicollinearity is the issue. Based on my theorization, SHR represents the proportion of social housing in the housing stock and DR represents the yearly demolition rate, which are improbable to be highly correlated. Furthermore, the correlation matrix revealed a correlation coefficient of 0.1685 between these two variables, which I consider relatively low. $\endgroup$
    – Joanna
    Commented May 14, 2023 at 7:50

Your Answer

By clicking “Post Your Answer”, you agree to our terms of service and acknowledge you have read our privacy policy.

Not the answer you're looking for? Browse other questions tagged or ask your own question.