2
$\begingroup$

I have a small data set of 18 persons. I have an outcome variable Y, and 200 predictors. These predictors were chosen based on biology and prior data.

I used the caret R package and split the data set in two, a training set of 10 persons and a test set of the remaining 8 persons.

I then trained a RIDGE model using glmnet on the 10 persons with 4-fold cross validation. I then predicted the outcome on the remaining 8 persons using the trained model.

The correlation between actual Y and predicted Y was r=0.933, which is amazingly good. Too good to be true?

Heres my codes:

set.seed(7)
a <- createDataPartition(dfpred$Y, list=FALSE)
training <- dfpred[a,]
test <- dfpred[-a,]

library(mlbench)
library(caret)

control <- trainControl(method = "cv", number = 4)

set.seed(7)
modelRIDGE <- train(Y~., data=training, method="glmnet", trControl=control, tuneGrid = expand.grid(alpha = 0, lambda = 0))

MEA: 0.9280647
RMSE: 1.071609
R squared: 0.9748333

hm=predict(object=modelRIDGE,newdata=test[,-1])
cor.test(hm,test$Y) # r=0.933 p<0.001

This looks very very good. So good that I worry I have overlooked something? Any input would help, thank you!

A note on the data: Its clinical relevant basic research on difficult/rare human species. The data are really unique and tries på predict body glucose uptake based on serum protein concentrations. The methods are really robust and accurate. The sample size is small, but there are no larger data sets of this type available anywhere.

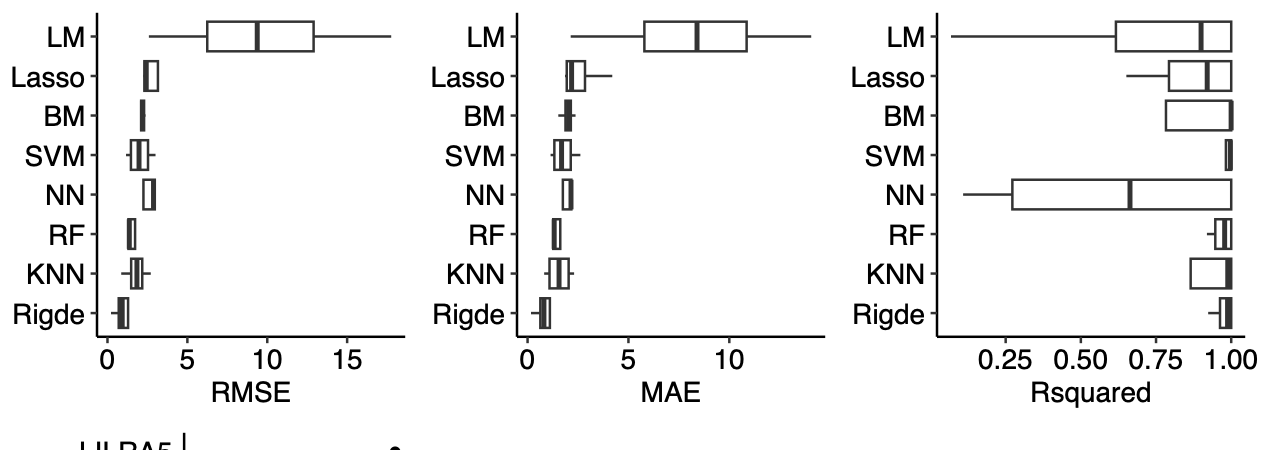
I also tested some other models: enter image description here

$\endgroup$
14
  • $\begingroup$ Hard to tell. Have you tried making some simple model and comparing it to your model? It could be something as simple as just forecasting the train outcome mean (or something more meaningful depending on the context). $\endgroup$ Commented Oct 2, 2023 at 9:47
  • $\begingroup$ I have not done that, actually I dont know how. I did however use these models as well: lm, rf, svRadial, nnet, knn, bartMachine, lasso. rf and lasso were also good, lm was the the worst. Ridge was the best. $\endgroup$ Commented Oct 2, 2023 at 10:01
  • 1
    $\begingroup$ I think with this sample size and provided the true solution is sparse or with particular collinearities this is perfectly well possible. Ridge penalties work perfectly well when p>>n. I fitted models with 1 million candidate features, 50 true nonzero coefficients and 500 observations and iterative adaptive ridge fits would recover 36/50 with 0 FP. That's a much less favourable variable/obs ratio than what you have... $\endgroup$ Commented Oct 2, 2023 at 17:44
  • 1
    $\begingroup$ This is exactly the kind of “building upon” research that is never reproducible and will waste grant dollars. $\endgroup$ Commented Oct 3, 2023 at 12:32
  • 1
    $\begingroup$ Maybe worth reading up on degrees of freedom first before you use caret. You can't use (or even feature select) 18 variables, let alone 200. It's mathematically impossible. One action worth considering is using PCA to create a single predictor out of variables chosen based on empirical knowledge in your field - not because glmnet tells you one variable is more important than another. $\endgroup$
    – J. Doe.
    Commented Oct 3, 2023 at 16:11

2 Answers 2

8
$\begingroup$

Split sample validation can require up to 20,000 observations to perform well enough. Otherwise the results may depend dramatically on the luck of the split. That’s why 100 repeats of 10-fold cross-validation or several hundred bootstrap resamples provide better estimates of likely model performance in most cases.

The number of observations needed to only estimate a residual variances is 70. The number of observations needed only to estimate the intercept in a binary logistic model is 96. Estimation of a single correlation coefficient with precision requires 300 observations. Those are much easier tasks that what you are doing, so there is no hope for looking at 200 predictors with your sample size.

This lack of hope is cemented by considering that ridge regression like lasso and elastic net depend on your being able to choose the value of penalty parameters, usually done through cross-validation. The minimum sample size needed to reliably choose a penalty parameter is at least in the hundreds.

The only hope is to ask questions of the data that the data are capable of answering. This involves using data reduction (unsupervised learning) on the 200 features to reduce them to one or two numbers that you can then play against Y. Principal components analysis is often used for this purpose. The PCs will be very unstable, but not unstable in a way that makes prediction of Y optimistic.

These issues are dealt with in detail in RMS.

Variable importance is a misleading measure in this context unless you get confidence intervals for the importance measures. If you run the bootstrap exercise at the end of this on your data, you’ll find that the data are consistent with the “winning” feature also being the biggest loser.

$\endgroup$
2
  • 1
    $\begingroup$ Thanks for your general answer. However, I am not sure how relevant it is for my special case using ridge. $\endgroup$ Commented Oct 3, 2023 at 7:14
  • 2
    $\begingroup$ It’s relevant because you can’t use split-sample validation with non-huge datasets and because you don’t have (within a factor of at least 10) enough sample size to pick a ridge parameter. If your sample doesn’t support estimation of a single correlation coefficient you certainly can’t do anything more complex than that. $\endgroup$ Commented Oct 3, 2023 at 12:30
3
$\begingroup$

A quick-and-dirty demonstration might be instructive to supplement Frank's answer:

n <- 18
control <- caret::trainControl(method = "cv", number = 4)
set.seed(1)

res <- replicate(1000, {
  dfpred <- data.frame(Y = rnorm(n))
  
  for(i in 1:200) dfpred[paste0("X", i)] <- rnorm(n)
  
  a <- caret::createDataPartition(dfpred$Y, list=FALSE)
  training <- dfpred[a,]
  test <- dfpred[-a,]
  
  modelRIDGE <- caret::train(Y~., data=training, method="glmnet",
                             trControl=control,
                             tuneGrid = expand.grid(alpha = 0, lambda = 0))
  
  hm=predict(object=modelRIDGE,newdata=test[,-1])
  cor.test(hm,test$Y)$estimate
})

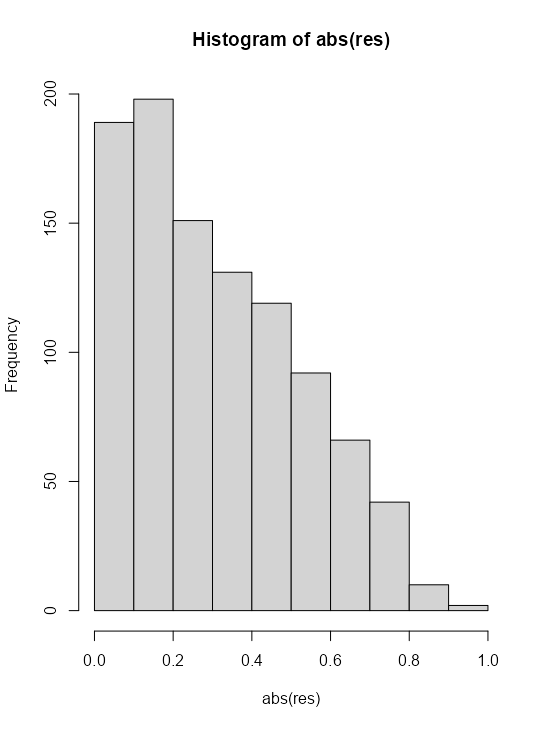
As you can see even total random noise can pretty easily give values >0.9:

Histogram of simulated values

Here we have two results above >0.9 in absolute value (one is even larger than yours, with 0.94). Again, from pure noise with only 1000 simulations - thus, having a value of 0.93 doesn't really mean that much, and it is unfortunately surely not "amazingly good" at least in my view in the light of the above simulation.

$\endgroup$
1
  • 1
    $\begingroup$ Thank you! However, two out all all these test seems pretty good to me! In science we do not rely only on one test anyways, we triangulate the results. I think my result is still so good that it deserves to be followed up. I interpret your answer actually to support that statement. $\endgroup$ Commented Oct 11, 2023 at 4:22

Your Answer

By clicking “Post Your Answer”, you agree to our terms of service and acknowledge you have read our privacy policy.

Not the answer you're looking for? Browse other questions tagged or ask your own question.