2
$\begingroup$

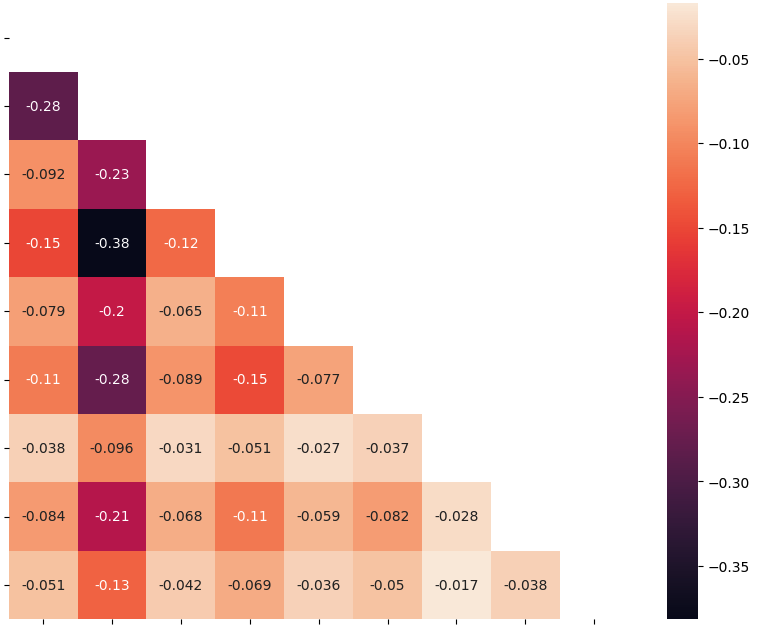
Putting aside the fact that this are, on the whole, fairly weak correlations, does this correlation heatmap of products used by various users, which has ONLY negative values, seem strange to anyone?

I'm new to this type of analysis but something about this seems odd: when a raise in the value of everything correlates to a lowering in the value of EVERYTHING else. I guess it could be that a use of one means NOT using another but that seems a little "zero sum".

Am I overthinking this?

correlation

$\endgroup$
4
  • 1
    $\begingroup$ Pairwise scatterplots are usually the best way to understand otherwise baffling correlational results. $\endgroup$
    – user78229
    Commented Nov 24, 2023 at 11:56
  • $\begingroup$ Cheers for the suggestion, @MikeHunter . Would a Pairwise scatterplot be primarily a pairplot or a scatterplot? I'm using seaborn and out-of-the-box neither seem to give me what I need, but I imagine I could get there with some digging. $\endgroup$ Commented Nov 24, 2023 at 12:14
  • $\begingroup$ Are you conditioning on anything for this plot? $\endgroup$
    – Firebug
    Commented Nov 24, 2023 at 13:16
  • 4
    $\begingroup$ A standard term for M. Hunter's "pairwise scatterplot" is scatterplot matrix. Although all-negative correlation matrices (off diagonal) are unusual, this one at least is mathematically possible. In fact, it is a minor perturbation of the examples given recently at stats.stackexchange.com/questions/631550: one eigenvalue is nearly zero while the others are nearly identical. This gives us (considerable) insight into what might be going on: namely, it looks like your variables sum to a value that is nearly constant. $\endgroup$
    – whuber
    Commented Nov 24, 2023 at 15:22

2 Answers 2

2
$\begingroup$

As you correctly point out, if you impose a fixed sum on a set of random variables then it will tend to impose negative correlation between the elements. An example of this occurs in multinomial random vectors, where all the elements of the random vector are negatively correlated with one another. So in view of that, it is not necessarily strange to get this pattern, and it is suggestive of a relationship where an increase in one element tends to lead to a decrease in all other elements.

$\endgroup$
1
$\begingroup$

"Putting aside the fact that ... weak correlations" seems wrong. What this looks like is a collection of random deviations from 0 (except maybe for item 2).

And you say that these are "products used by various users" -- well, if the items serve similar purposes, then using one might well lead to less use of another. It would help if you told us what the products were.

Finally, if use of a variable is "yes/no" then I'm not sure a correlation is the best way to capture the relationship. It might be, but .. why did you choose that measure?

$\endgroup$
3
  • $\begingroup$ The products are web services, so this data indicates when a user has used that service in the period in question. There's no reason why someone couldn't use all of the products. I'm not married to the idea of using correlation. In fact, if there's something that explains the relationship between these things - if there is one - better, I'm happy to use that. $\endgroup$ Commented Nov 24, 2023 at 14:21
  • $\begingroup$ There are a whole bunch of ways of looking at the association in a 2x2 table. Odds ratios, risk ratios, $\phi$, Cramer's V, and more. $\endgroup$
    – Peter Flom
    Commented Nov 24, 2023 at 14:29
  • 1
    $\begingroup$ I warmly recommend performing some analysis before answering questions. See my comment to the question for what that can achieve. $\endgroup$
    – whuber
    Commented Nov 24, 2023 at 15:22

Your Answer

By clicking “Post Your Answer”, you agree to our terms of service and acknowledge you have read our privacy policy.

Not the answer you're looking for? Browse other questions tagged or ask your own question.