2
$\begingroup$

Let say I have following simple linear regression

$y = \alpha + \beta X + \epsilon$

Here $X$ is ordered categorical variable, let say with categories represented by 1 to 12.

Now in typical regression equation, we predict the value of $y$ from $X$ as

$\hat{y} = \hat{\alpha} + \hat{\beta}X$

However here my problem is different, given a value of $y$ I want to predict possible value of $X$.

For this I think I need to construct coontinuous and non-overlapping interval for possible $y$ values for each category of $X$ i.e. there will be 10 overlapping intervals of $y$ e.g.

if $y_{Val}$ falls within $ \left( -\inf, y_1 \right]$ then I would predict the value of $X = 1$ if $y_{Val}$ falls within $ \left( y_1, y_2 \right]$ then I would predict the value of $X = 2$ so on

My goal is to BEST estimate the value of $y_1, y_2, ..,y_9$.

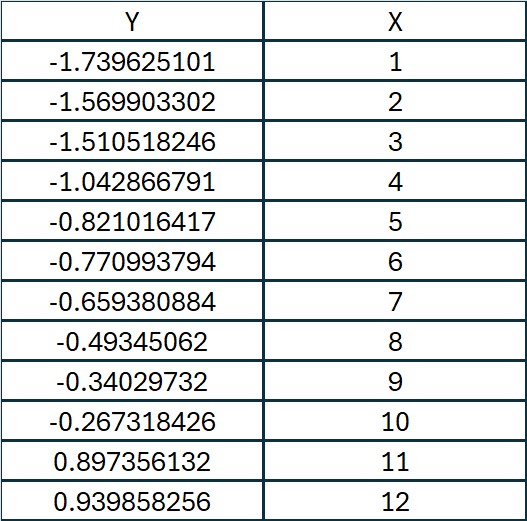
My data looks like below

enter image description here

$\endgroup$
4
  • 1
    $\begingroup$ "BEST estimate of $y_i$" is ambiguous. Do you want the lowest expected squared error between your prediction of $X$ and the actual? Or something else? See Kolassa (2020) and note that the same argument applies in your situation, even though it is not about forecasting. $\endgroup$ Commented Dec 5 at 13:54
  • $\begingroup$ Based on the table of your data, you seem to have only a single observation for each X? (and btw, you mention that categories are coded 1 thru 10, but the table shows 12 of them?). There are not enough observations to do any statistics? Just pick the halfway point between your observed Y's (which increase monotonously with the value of X) and call it a day; since there is only 1 observation per, we have no idea of the possible variability, and this trivial approach is about as good as you could do. $\endgroup$
    – jginestet
    Commented Dec 5 at 18:22
  • $\begingroup$ @jginestet Actually there are 12 categories not 10, I corrected my original post. I had to mask my data so this typo had happened. Regrading that you mentioned that we have no idea on possible variability, can we take $SD$ of all $Y$ observations (12 points) can use that as some measure of variability? Do you think of any issue with that? $\endgroup$ Commented Dec 6 at 7:42
  • $\begingroup$ Yes, a big issue. The SD of all Y's is the variability between the categories; but you do not have the variability within each category (sum of sqaures between, vs sum of squares within). E.g. category 1 has a single observation at -1.739625; if you took another observation for this category, would it still be 1.739625?. W/o the sd of the data for category 1 (and 2) we can not set an "optimal" threshold" between them (find the $y_1$ which best separates them). So picl the halfway point, but you have no way of knowing how good (or bad) it will be... Is that really all the data you have? $\endgroup$
    – jginestet
    Commented Dec 6 at 17:24

1 Answer 1

3
$\begingroup$

You write:

However here my problem is different, given a value of y I want to predict possible value of X.

Then I would run a regression of X on Y and, given that X is ordinal, I would start with ordinal logistic regression.

$\endgroup$
1
  • $\begingroup$ It's important to recognize that this can completely change the error model and therefore is not always a good or even valid solution. $\endgroup$
    – whuber
    Commented Dec 5 at 15:56

Not the answer you're looking for? Browse other questions tagged or ask your own question.